Insights paper - APRA Choice Heatmap
Dashboard
An accessible version of the dashboard is available here.
Introduction
APRA is focused on driving a culture of continuous improvement, accountability, and transparency in the delivery of quality outcomes by RSE licensees to superannuation members.
Legislative reforms, including the annual performance test, have sharpened the focus on the financial nature of an RSE licensee’s duty to act in the best financial interests of beneficiaries.
APRA is also reviewing Prudential Standard SPS 515 Strategic Planning and Member Outcomes1 (‘SPS 515’). The SPS 515 framework requires RSE licensees to embed a holistic approach to assessing and improving the delivery of outcomes to members.
APRA’s heatmaps provide comparable information on performance of MySuper and Choice products across multiple dimensions: investment returns, fees and costs and sustainability.
This Insights Paper provides key insights from the Choice Heatmap (‘the heatmap’) covering a specific segment of the Choice sector, namely accumulation phase and multi-sector investment options. RSE licensees are the key audience for the heatmap and this Insights Paper.
APRA uses the heatmap as a tool to hold RSE licensees to account for underperformance and help them identify areas for ongoing improvement. APRA expects RSE licensees to take both the annual performance test and heatmaps into account when assessing performance, to identify where outcomes for members need to be improved and how such improvements will be made.
APRA’s supervision of RSE licensees will continue to focus on how an RSE licensee assesses its performance, how it will act to improve member outcomes based on this assessment and, in certain cases, whether the RSE licensee’s assessment of its strategic future and longer-term viability is reasonable.
This Insights Paper covering the heatmap for the Choice sector may be read in conjunction with the Insights Paper for the MySuper Heatmap published by APRA in December 2022.
Key Insights
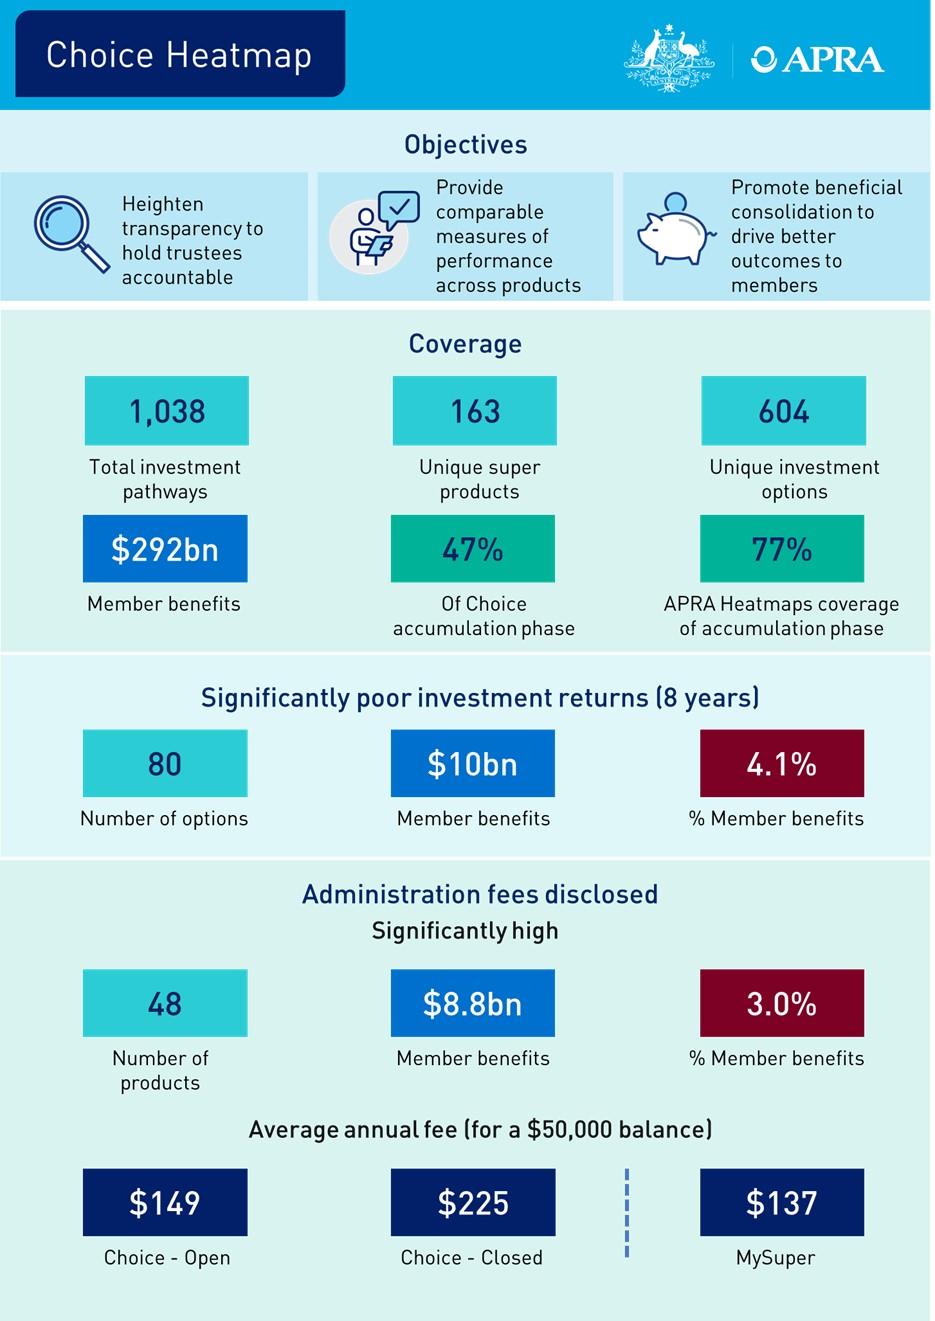
1.1 Choice Heatmap coverage
The APRA-regulated superannuation industry has grown significantly in recent years and has almost $2 trillion in member benefits as at 30 June 2022. Choice product offerings are an important part of the overall system with $995 billion in member benefits spread across accumulation and retirement products, while there is $809 billion in MySuper products and $147 billion in Defined Benefit products2. The accumulation phase of the Choice sector accounted for $620 billion of member benefits as at 30 June 2022. The heatmap covers investment pathways across 68 Registrable Superannuation Entities (RSEs), representing $292 billion of member benefits as at 30 June 2022 or 47% of the accumulation phase of the Choice sector.
Superannuation members can access Choice investment options through different superannuation products and investment menus, which may involve different fee and cost structures and lead to different return outcomes. The terminology “investment pathway” is used in the heatmap to describe each of these unique combinations of superannuation product, investment menu and investment option. The investment pathways included in the heatmap cover the accumulation phase, where the underlying investment options are offered through generic investment menus (not platforms) and are multi sector3.
The heatmap includes investment pathways that are open to new members as well as those that have existing members but are now closed to new members. Open investment pathways comprise around 59% of the investment pathways shown in the heatmap. Closed investment pathways account for the remaining 41%. These closed pathways tend to have lower levels of member benefits but still represent $17 billion, or 5.9%, of the member benefits included in the heatmap.
The heatmap includes data for 163 superannuation products. The superannuation product is the key determinant of administration fees disclosed for the investment pathways in the heatmap (noting that platform investment menus are excluded). Administration fees are generally levied at the product level and reflect the cost of providing product features and services to members.
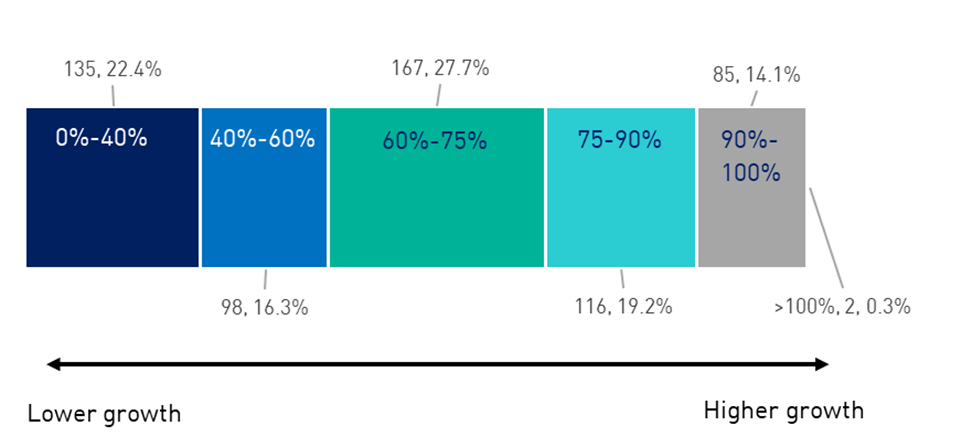
The heatmap includes data for 604 distinct investment options, 441 (73%) of which are accessed via one investment pathway only, with 163 (27%) accessible through multiple superannuation products and/or investment menus. Figure 1 highlights the broad cross-section of investment strategies covered by the heatmap, from highly defensive asset allocations through to high growth focused asset allocations.
Figure 1. Breakdown of investment options by strategic growth asset allocation category4
Total fees and costs disclosed for investment pathways in the heatmap are affected by both the overarching superannuation product (which drives administration fees) and the ultimate investment option that the member is invested in (which drives investment fees and costs).
1.2 Investment returns
Investment performance is the key driver of net returns generated for members. Investment performance is driven by the investment strategy, which is set and executed at the investment option level of the investment pathway. Poor investment performance compounded over time can result in significant detriment to retirement outcomes for members.
The heatmap assesses investment performance over three, five and eight year periods using three different benchmarking methods. Multiple benchmarking methods are used to assess different aspects of investment management, such as how strategies are set and how they are executed. Table 1 summarises details of the investment options that have return histories available for each time horizon.
Table 1. Investment Options by Length of Return History Available
| 8 years | 5 years | 3 years |
# Investment Options | 407 | 455 | 498 |
Open | 327 | 369 | 412 |
Closed | 80 | 86 | 86 |
Member Benefits ($billion) | 247 | 254 | 260 |
Open | 240 | 247 | 253 |
Closed | 7 | 7 | 7 |
# of RSEs | 57 | 62 | 63 |
# of RSELs | 48 | 50 | 50 |
Figure 2 summarises the average investment performance across the three investment benchmarks (‘performance relative to heatmap benchmarks’) by number of options, for each of the timeframes used in the heatmap.
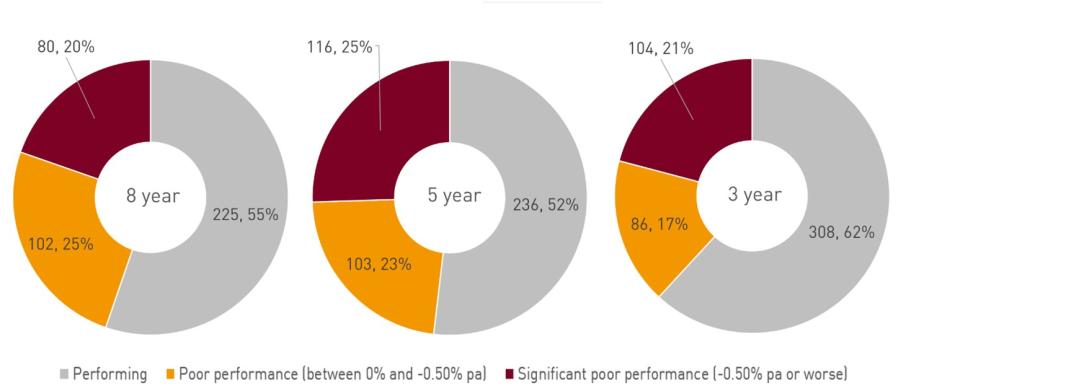
Of the 604 multi-sector investment options covered in the heatmap, 407 options have an eight-year return history, representing 84.6% or $247 billion of member benefits. 182 of these options have underperformed relative to the heatmap benchmarks, representing 45% of the number of options with an eight-year history (or 17.0% of the value of member benefits for options with an eight-year history). 80 of these options have significantly underperformed the heatmap benchmarks by more than 0.50% on average per annum, representing 20% of options with an eight-year history (or 4.1% of the value of member benefits for options with an eight-year history). The list of these 80 options is provided in Appendix 1.
Members in investment options that are now closed have tended to fare worse than those in options that remain open. Closed options are more likely to have underperformed relative to heatmap benchmarks than open options (see Figure 3). While past return trends and historical investment performance are no guarantee of future returns, this demonstrates a potential harm to members that remain in closed investment options. RSE licensees must demonstrate how retaining members in underperforming closed investment options remains in members’ best financial interests or take active steps to identify suitable better performing options or products for these members to be transferred to. RSE licenses must also ensure that any remaining closed products or options continue to receive appropriate investment management and governance oversight.
Figure 3. Performance relative to heatmap benchmarks (% of options) – Closed vs Open vs MySuper5 (8 year)
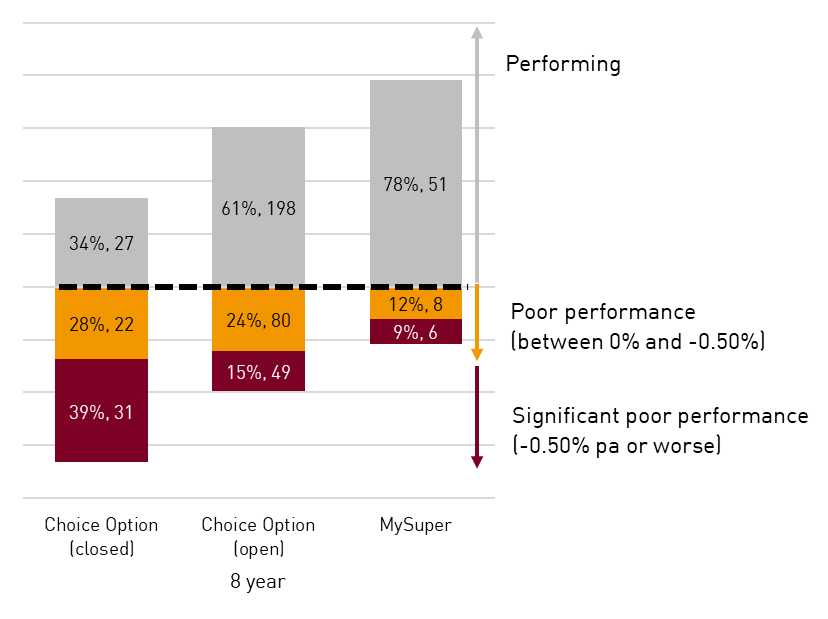
Choice investment options (whether closed or open) tended to have worse performance relative to benchmarks than MySuper products. Over the eight-year horizon, 39% of open Choice investment options fell below benchmark compared to 67% for closed Choice investment options and 21% of MySuper products (see Figure 3). Over the same period, 15% of open Choice investment options were significantly below benchmark compared to 39% of closed Choice investment options and 9% of MySuper products.
When considering the total levels of member benefits affected, 4.1% ($36 billion) of total member benefits in MySuper products were in those with significant poor performance. The equivalent figures in the Choice Heatmap are:
- 4.1% ($10 billion) across all Choice options;
- 3.5% ($8 billion) when considering open Choice options only; and
- 24.5% ($2 billion) when considering closed Choice options only.
APRA requires that RSE licensees implement a sound investment governance framework that covers all their investment options and to manage investments in line with the interests of beneficiaries. APRA expects RSE licensees to take timely action to address underperformance. RSE licensees should consider the appropriateness of continuing to operate closed legacy products, and whether more proactive steps to facilitate the movement of members into performing open products is in members’ best financial interests.
1.3 Fees and costs
Administration fees disclosed
The administration fees disclosed for each investment pathway are almost exclusively driven by pricing structures set at the overarching superannuation product to which the pathway relates. This is because administration fees are generally structured, and levied, at the product level.
Figure 4 illustrates the distribution of administration fees for Choice products open to new members, Choice products closed to new members and MySuper products6. The median administration fee for closed Choice products is $350 per annum for a member with a $50,000 balance. This is significantly higher than the median fee for open Choice products, which is $177 and MySuper products which have a median fee of $143. There are 48 Choice products with significantly higher administration fees and costs (i.e. above the crimson threshold across three or more account balances in the heatmap), accounting for 29% of all Choice products included in the heatmap and $8.8 billion of member benefits. These products are concentrated in 16 RSEs governed by 7 RSE licensees. All but two of these RSEs have assets less than $10 billion, illustrating how smaller funds often find it difficult to achieve the economies of scale required to offer products with competitive fees and costs.
Figure 4. Choice administration fees disclosed at $50,000 account balance as at 1 October 2022 (product level)
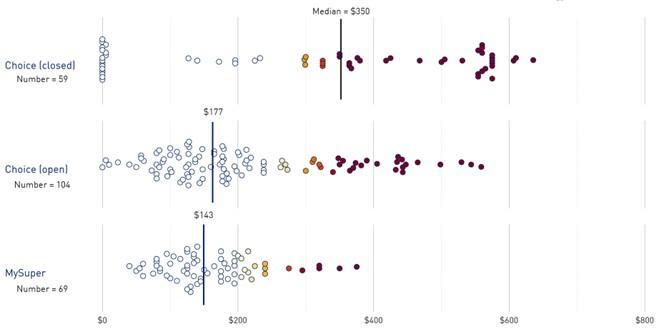
The administration fees of several closed Choice products are particularly high, with administration fees almost 70% higher than even the most expensive MySuper products. The asset-weighted average annual administration fee faced by members with an account balance of $50,000 in closed Choice products is $225, which compares with $149 for open Choice products and $137 for MySuper products.
The 48 products with significantly high administration fees tend to have lower levels of member benefits, consistent with the fact that most of these products are offered in smaller RSEs, although in aggregate they still account for $8.8 billion or 3.0% of the member benefits covered by the heatmap. The list of these 48 products, offered by 17 RSEs, is provided in Appendix 2.
RSE licensees must be able to demonstrate the value of their product offerings (including services and features) and that fees charged are in the best financial interests of members. Where fees are not required to support the provision of product and member services, APRA expects RSE licensees to reduce fees or consider other actions such as transferring members to lower fee products or fund consolidation, to improve outcomes for members.
Appendix A: In addition, the heatmap demonstrates that, among closed products, those with significantly high fees also have a greater tendency to have investment options that have underperformed relative to investment benchmarks. Closed investment pathways account for the majority (95% or 59 of 62) of investment pathways that have both significantly high administration fees and significantly poor investment performance relative to benchmarks.
1.4 Sustainability
Sustainability measures are calculated at RSE level, to assess the ability of RSE licensees to provide member services on an ongoing basis.
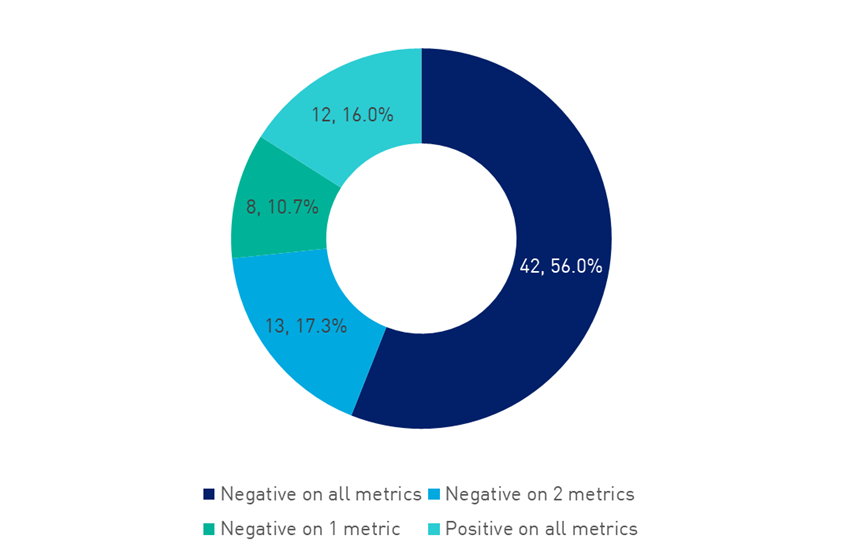
The findings of the sustainability section of the MySuper Heatmap Insights Paper published in December 2022 remain relevant when the population is expanded to include RSEs in the Choice Heatmap. The majority of RSEs face declining growth profiles across the sustainability metrics featured in the heatmap (see Figure 5)7.
Figure 5. Percentage of RSEs by number of negative sustainability metrics
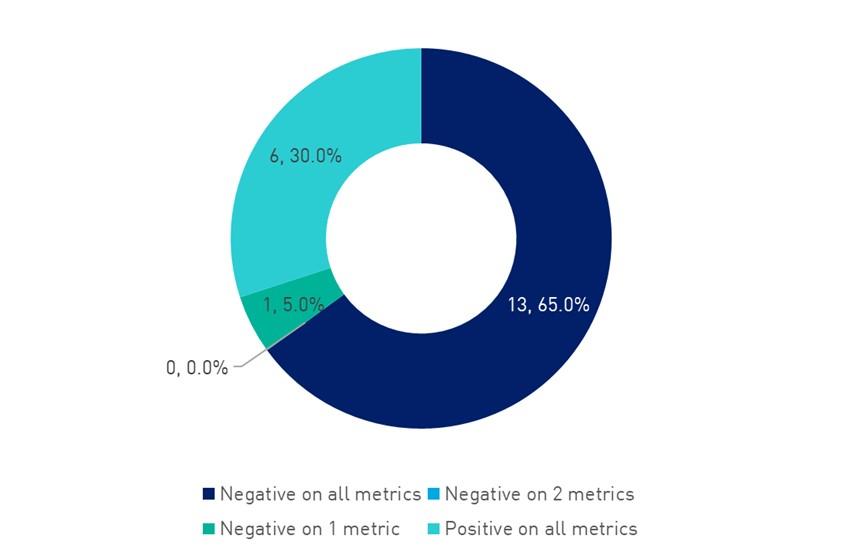
There is wide variation across the sustainability metrics for the 20 RSEs included in the Choice Heatmap that do not have MySuper products – 13 of those RSEs have experienced negative growth on all three metrics, 6 have experienced positive growth on all three metrics while one experienced a mixture of positive and negative growth across the metrics (see Figure 6). These RSEs tend to be smaller than those that also have MySuper products, with a few that have much larger growth rates (from a low base) than the broader universe of RSEs but also many with particularly weak growth profiles indicating potential sustainability challenges.
Figure 6. Percentage of RSEs that have Choice (but not MySuper) products by number of negative sustainability metrics
RSEs that maintain closed investment pathways also tend to have weak sustainability metrics. In some cases, such as small corporate funds that no longer accept new members, this is because the closed product is the only product offered by an RSE licensee or is one of only a few. In other cases, the combination of closed pathways remaining on offer and weak sustainability metrics may be symptomatic of other concerns in the business models or governance of RSEs.
RSE licensees should take account of growth profiles in their business planning activities and consider the likely effects and risks for member outcomes. Sufficient scale is required to support efficient and resilient business models, keep fees and costs low, and finance operational and service improvements expected by their members and APRA. APRA expects that RSE licensees will consider options to transfer members or otherwise restructure their businesses, particularly where sustainability pressures are significant and/or the growth outlook is weak.
Appendix 1 - Significantly poor investment returns (8-year)
RSE Licensee | RSE | Investment Option Name |
AUSCOAL Superannuation Pty Ltd | Mine Superannuation Fund | Conservative Balanced Super |
AUSCOAL Superannuation Pty Ltd | Mine Superannuation Fund | Growth Super |
AUSCOAL Superannuation Pty Ltd | Mine Superannuation Fund | High Growth Super |
Avanteos Investments Limited | Colonial First State FirstChoice Superannuation Trust | FirstChoice Wholesale High Growth |
Avanteos Investments Limited | Colonial First State FirstChoice Superannuation Trust | Perpetual Wholesale Balanced Growth |
Avanteos Investments Limited | Colonial First State FirstChoice Superannuation Trust | Perpetual Wholesale Diversified Growth |
AvSuper Pty Ltd | AvSuper Fund | Accumulation - High Growth |
BT Funds Management Limited | Retirement Wrap | BT Super For Life Advance Conservative |
BT Funds Management Limited | Retirement Wrap | BT Super For Life Advance Growth |
BT Funds Management Limited | Retirement Wrap | BT Super For Life Advance Higher Growth |
BT Funds Management Limited | Retirement Wrap | BT Super For Life Advanced Balanced |
Energy Industries Superannuation Scheme Pty Ltd | Energy Industries Superannuation Scheme-Pool A | Conservative Balanced |
Energy Industries Superannuation Scheme Pty Ltd | Energy Industries Superannuation Scheme-Pool A | Conservative |
Energy Industries Superannuation Scheme Pty Ltd | Energy Industries Superannuation Scheme-Pool A | High Growth |
Equity Trustees Superannuation Limited | Crescent Wealth Superannuation Fund | Crescent Wealth Super Balanced |
Equity Trustees Superannuation Limited | Crescent Wealth Superannuation Fund | Crescent Wealth Super Conservative |
Equity Trustees Superannuation Limited | Crescent Wealth Superannuation Fund | Crescent Wealth Super Growth |
Equity Trustees Superannuation Limited | National Mutual Retirement Fund | Provider Personal Retirement Plan - Matched |
Equity Trustees Superannuation Limited | National Mutual Retirement Fund | Provider Personal Retirement Plan - Secure |
Equity Trustees Superannuation Limited | National Mutual Retirement Fund | Provider Top Up Retirement Plan - Matched |
Equity Trustees Superannuation Limited | National Mutual Retirement Fund | Provider Top Up Retirement Plan - Secure |
Equity Trustees Superannuation Limited | National Mutual Retirement Fund | Retirement Security Plan - Growth |
Equity Trustees Superannuation Limited | National Mutual Retirement Fund | RLA Personal Super Plan - Multi-manager Secure |
Equity Trustees Superannuation Limited | Super Retirement Fund | Balanced |
Equity Trustees Superannuation Limited | Super Retirement Fund | Balanced|2 |
Equity Trustees Superannuation Limited | Super Retirement Fund | Capital Defensive |
Equity Trustees Superannuation Limited | Super Retirement Fund | Capital Secure |
Equity Trustees Superannuation Limited | Super Retirement Fund | Capital Stable* |
Equity Trustees Superannuation Limited | Super Retirement Fund | Capital Stable* |
Equity Trustees Superannuation Limited | Super Retirement Fund | Capital Stable|2 |
Equity Trustees Superannuation Limited | Super Retirement Fund | Capital Stable|5 |
Equity Trustees Superannuation Limited | Super Retirement Fund | Growth |
Equity Trustees Superannuation Limited | Super Retirement Fund | Growth|1 |
Equity Trustees Superannuation Limited | Super Retirement Fund | Growth|3 |
Equity Trustees Superannuation Limited | Super Retirement Fund | Growth|6 |
Equity Trustees Superannuation Limited | Super Retirement Fund | Growth|7 |
Equity Trustees Superannuation Limited | Super Retirement Fund | Growth|8 |
Equity Trustees Superannuation Limited | Super Retirement Fund | Growth|9 |
Equity Trustees Superannuation Limited | Super Retirement Fund | High Growth|3 |
Equity Trustees Superannuation Limited | SuperTrace Superannuation Fund | Capital Stable Fund |
Equity Trustees Superannuation Limited | Zurich Master Superannuation Fund | ZRP BALANCED |
Equity Trustees Superannuation Limited | Zurich Master Superannuation Fund | ZRP CAPITAL STABLE |
Equity Trustees Superannuation Limited | Zurich Master Superannuation Fund | ZRP MANAGED GROWTH |
Equity Trustees Superannuation Limited | Zurich Master Superannuation Fund | ZRP MANAGED SHARE |
Nulis Nominees (Australia) Limited | MLC Super Fund | BlackRock Global Allocation Fund |
OnePath Custodians Pty Limited | Retirement Portfolio Service | ANZ Smart Choice Growth |
OnePath Custodians Pty Limited | Retirement Portfolio Service | ANZ Smart Choice Moderate |
OnePath Custodians Pty Limited | Retirement Portfolio Service | BlackRock Diversified ESG Growth |
OnePath Custodians Pty Limited | Retirement Portfolio Service | BlackRock Tactical Growth |
OnePath Custodians Pty Limited | Retirement Portfolio Service | OnePath Active Growth |
OnePath Custodians Pty Limited | Retirement Portfolio Service | OnePath Balanced |
OnePath Custodians Pty Limited | Retirement Portfolio Service | OnePath Balanced Index |
OnePath Custodians Pty Limited | Retirement Portfolio Service | OnePath Capital Stable |
OnePath Custodians Pty Limited | Retirement Portfolio Service | OnePath Conservative |
OnePath Custodians Pty Limited | Retirement Portfolio Service | OnePath Conservative Index |
OnePath Custodians Pty Limited | Retirement Portfolio Service | OnePath Growth Index |
OnePath Custodians Pty Limited | Retirement Portfolio Service | OnePath High Growth |
OnePath Custodians Pty Limited | Retirement Portfolio Service | OnePath High Growth Index |
OnePath Custodians Pty Limited | Retirement Portfolio Service | OnePath Income |
OnePath Custodians Pty Limited | Retirement Portfolio Service | OnePath Managed Growth |
OnePath Custodians Pty Limited | Retirement Portfolio Service | OnePath Tax Effective Income |
OnePath Custodians Pty Limited | Retirement Portfolio Service | OptiMix Balanced |
OnePath Custodians Pty Limited | Retirement Portfolio Service | OptiMix Conservative |
OnePath Custodians Pty Limited | Retirement Portfolio Service | OptiMix Growth |
OnePath Custodians Pty Limited | Retirement Portfolio Service | OptiMix High Growth |
OnePath Custodians Pty Limited | Retirement Portfolio Service | OptiMix Moderate |
OnePath Custodians Pty Limited | Retirement Portfolio Service | Pendal Monthly Income Plus |
OnePath Custodians Pty Limited | Retirement Portfolio Service | Perpetual Balanced Growth |
OnePath Custodians Pty Limited | Retirement Portfolio Service | Perpetual Conservative Growth |
OnePath Custodians Pty Limited | Retirement Portfolio Service | Russell Balanced Class A |
OnePath Custodians Pty Limited | Retirement Portfolio Service | RUSSELL CAPITAL STABLE |
OnePath Custodians Pty Limited | Retirement Portfolio Service | RUSSELL DIVERSIFIED 50 CLASS A |
OnePath Custodians Pty Limited | Retirement Portfolio Service | Schroder Fixed Income |
OnePath Custodians Pty Limited | Retirement Portfolio Service | Schroder Real Return |
OnePath Custodians Pty Limited | Retirement Portfolio Service | Schroder Strategic Growth |
OnePath Custodians Pty Limited | Retirement Portfolio Service | UBS Balanced |
OnePath Custodians Pty Limited | Retirement Portfolio Service | UBS Defensive |
OnePath Custodians Pty Limited | Retirement Portfolio Service | UBS Diversified Fixed Income |
Perpetual Superannuation Limited | Perpetual WealthFocus Superannuation Fund | Schroder Sustainable Growth super option |
Rei Superannuation Fund Pty Limited | Rei Super | Conservative |
* These investment options have the same reported name as other investment options offered by that RSE (within the same product and investment menu) but actually represent different underlying investment options.
Appendix 2 - Significantly high administration fees disclosed
RSE Licensee | RSE | Product Name |
Diversa Trustees Limited | Future Super Fund | Verve Super Accumulation |
Diversa Trustees Limited | Grosvenor Pirie Master Superannuation Fund Series 2 | Simple Choice Accumulation |
Diversa Trustees Limited | Grosvenor Pirie Master Superannuation Fund Series 2 | Slate Super Accumulation |
Diversa Trustees Limited | OneSuper | Australian Practical Superannuation Accumulation |
Diversa Trustees Limited | OneSuper | Pearl YourChoice Complete Super Accumulation |
Diversa Trustees Limited | OneSuper | RetireSelect Complete Super Accumulation |
Diversa Trustees Limited | Tidswell Master Superannuation Plan | Cruelty Free Super |
Diversa Trustees Limited | Tidswell Master Superannuation Plan | Spaceship Super |
Diversa Trustees Limited | Tidswell Master Superannuation Plan | Student Super |
Diversa Trustees Limited | Tidswell Master Superannuation Plan | Superestate |
Equity Trustees Superannuation Limited | AMG Super | Acclaim Super |
Equity Trustees Superannuation Limited | Aracon Superannuation Fund | Elevate Accumulation |
Equity Trustees Superannuation Limited | Crescent Wealth Superannuation Fund | Crescent Wealth Superannuation Fund |
Equity Trustees Superannuation Limited | National Mutual Retirement Fund | Goldline Personal Superannuation Plan |
Equity Trustees Superannuation Limited | National Mutual Retirement Fund | Personal Superannuation Plan |
Equity Trustees Superannuation Limited | National Mutual Retirement Fund | Provider Personal Retirement Plan |
Equity Trustees Superannuation Limited | National Mutual Retirement Fund | Provider Top Up Retirement Plan |
Equity Trustees Superannuation Limited | National Mutual Retirement Fund | Retirement Bond |
Equity Trustees Superannuation Limited | National Mutual Retirement Fund | Retirement Security Plan |
Equity Trustees Superannuation Limited | National Mutual Retirement Fund | RLA Personal Super Plan |
Equity Trustees Superannuation Limited | Smart Future Trust | smartMonday DIRECT - Choice |
Equity Trustees Superannuation Limited | Super Retirement Fund | CPSL Master Fund Superannuation |
Equity Trustees Superannuation Limited | Super Retirement Fund | Personal Superannuation & Rollover Plan|1 |
Equity Trustees Superannuation Limited | Super Retirement Fund | Personal Superannuation & Rollover Plan|2 |
Equity Trustees Superannuation Limited | Super Retirement Fund | Retirement Saver |
Equity Trustees Superannuation Limited | Super Retirement Fund | Retirement Saver Series 2 |
Equity Trustees Superannuation Limited | Super Retirement Fund | Retirement Saver Series 2|1 |
Equity Trustees Superannuation Limited | Super Retirement Fund | Retirement Saver Series 2|2 |
Equity Trustees Superannuation Limited | Super Retirement Fund | Retirement Saver|1 |
Equity Trustees Superannuation Limited | Super Retirement Fund | Retirement Saver|2 |
Equity Trustees Superannuation Limited | Super Retirement Fund | Select Personal Superannuation|1 |
Equity Trustees Superannuation Limited | Super Retirement Fund | Select Personal Superannuation|2 |
Equity Trustees Superannuation Limited | Super Retirement Fund | SuperSelect |
Equity Trustees Superannuation Limited | Super Retirement Fund | SuperWise Series 4|1 |
Equity Trustees Superannuation Limited | Super Retirement Fund | SuperWise Series 4|2 |
Equity Trustees Superannuation Limited | Super Retirement Fund | SuperWise Series 5|1 |
Equity Trustees Superannuation Limited | Super Retirement Fund | SuperWise Series 5|2 |
Equity Trustees Superannuation Limited | Super Retirement Fund | SuperWise Series 5|3 |
Equity Trustees Superannuation Limited | Super Retirement Fund | Umbrella Financial Plan Super|1 |
Equity Trustees Superannuation Limited | Super Retirement Fund | Umbrella Financial Plan Super|2 |
Equity Trustees Superannuation Limited | Super Retirement Fund | Umbrella Investment Plan Super |
Equity Trustees Superannuation Limited | Zurich Master Superannuation Fund | Zurich Superannuation Plan (ZSP) |
LGSS Pty Limited | Local Government Super | Active Super Accumulation Scheme |
OnePath Custodians Pty Limited | Retirement Portfolio Service | ANZ Super Advantage |
Prime Super Pty Ltd | Prime Super | Choice - accumulation |
SPSL Limited | SPSL Master Trust | Suncorp Brighter Super |
SPSL Limited | SPSL Master Trust | Suncorp Brighter Super for business |
Towers Watson Superannuation Pty Ltd | Nissan Superannuation Plan | DC Division |
Glossary
Investment Menu means a grouping of investment options offered within a superannuation product that has a defined fee and cost structure for members to access. The same investment menu may be made available across more than one superannuation product. The investment menu types are generic, platform and lifecycle option.
Investment Option is an investment that an RSE licensee makes available for selection by a member that may comprise: (a) a mix of investments managed by an RSE licensee packaged as an investment option; or (b) an investment in a collective managed investment (externally managed investment option) that has been selected by an RSE licensee where, for practical reasons, some activities may be delegated to the manager of the externally managed investment option; or (c) a direct investment in one asset, such as an individual listed security, term deposit or bond (direct investment). Investment options are made available to members via investment menus within superannuation products. The same investment option may be made available across more than one investment menu. An open investment option is one that new members may currently access while a closed investment option is closed to new members.
Investment Pathway describes the unique combination of superannuation product, investment menu and investment option that a member can choose. An open investment pathway involves the product, investment menu and investment option all being open to new members. A closed investment pathway may result from any of the product, investment menu or investment option being closed to new members.
Multi Sector investment options (such as balanced, growth or conservative) are options that have investments held in more than one distinct security, belonging to two or more asset sectors.
Superannuation Product is the overarching offering made available to members by an RSE. Within products a member can choose investment options available on investment menus. An open product is accepting new members while a closed product is closed to new members.
Footnotes
1 Strategic planning and member outcomes: proposed enhancements.
2 APRA-regulated RSEs with more than four members, Quarterly Superannuation Industry Publication 2022.
3 Further details about the scope of investment pathways included and excluded are outlined in the methodology paper.
4 This excludes one investment option with no asset allocation data reported.
5 For the purposes of appropriate comparison with Choice options, for MySuper, APRA has used three benchmarks (SAA Benchmark Portfolio, Simple Reference Portfolio, NIR trendline).
6 A number of products reported zero or near zero administration fees, particularly among closed products. These are often because an employer group covers the administration fees instead of members or because some other rebates have been applied to the administration fees of members.
7 RSEs included in the MySuper Heatmap released in 2022 or the current Choice Heatmap.
For more information
Email DataAnalytics@apra.gov.au or mail to
Senior Manager, Superannuation Strategic Insights - Macro & Industry Insights
Australian Prudential Regulation Authority
GPO Box 9836, Sydney NSW 2001