Insights paper - 2023 Performance Test
Foreword
Increasing transparency for the superannuation industry is an important element of APRA’s strategic objective to improve retirement outcomes for the Australian community. The introduction of APRA’s superannuation heatmaps, coupled with the legislated Performance Test, have been significant drivers in improving product performance across the entire industry. This is, in part, because of the legislated consequences of failing the Performance Test and APRA’s supervisory intensity on underperforming products. However, a principal benefit of these publications is also the transparency they provide to trustees, to fund members and to the broader community.
APRA is committed to providing greater transparency for and insights into the superannuation industry. This paper and the accompanying data represent an additional step towards providing the community and the superannuation industry with more detailed analysis of the performance of MySuper and trustee directed products in the Performance Test.
In 2023, APRA collected and published more superannuation data than ever before. In 2024, APRA will increase superannuation performance transparency even further, aligning the timing of the performance test and heatmap publications so members and industry get timely information on product performance through a broad range of metrics.
It is more important than ever that we shine a light on the outcomes trustees are delivering for their members.
Margaret Cole
Deputy Chair
2023 Performance Test Dashboards
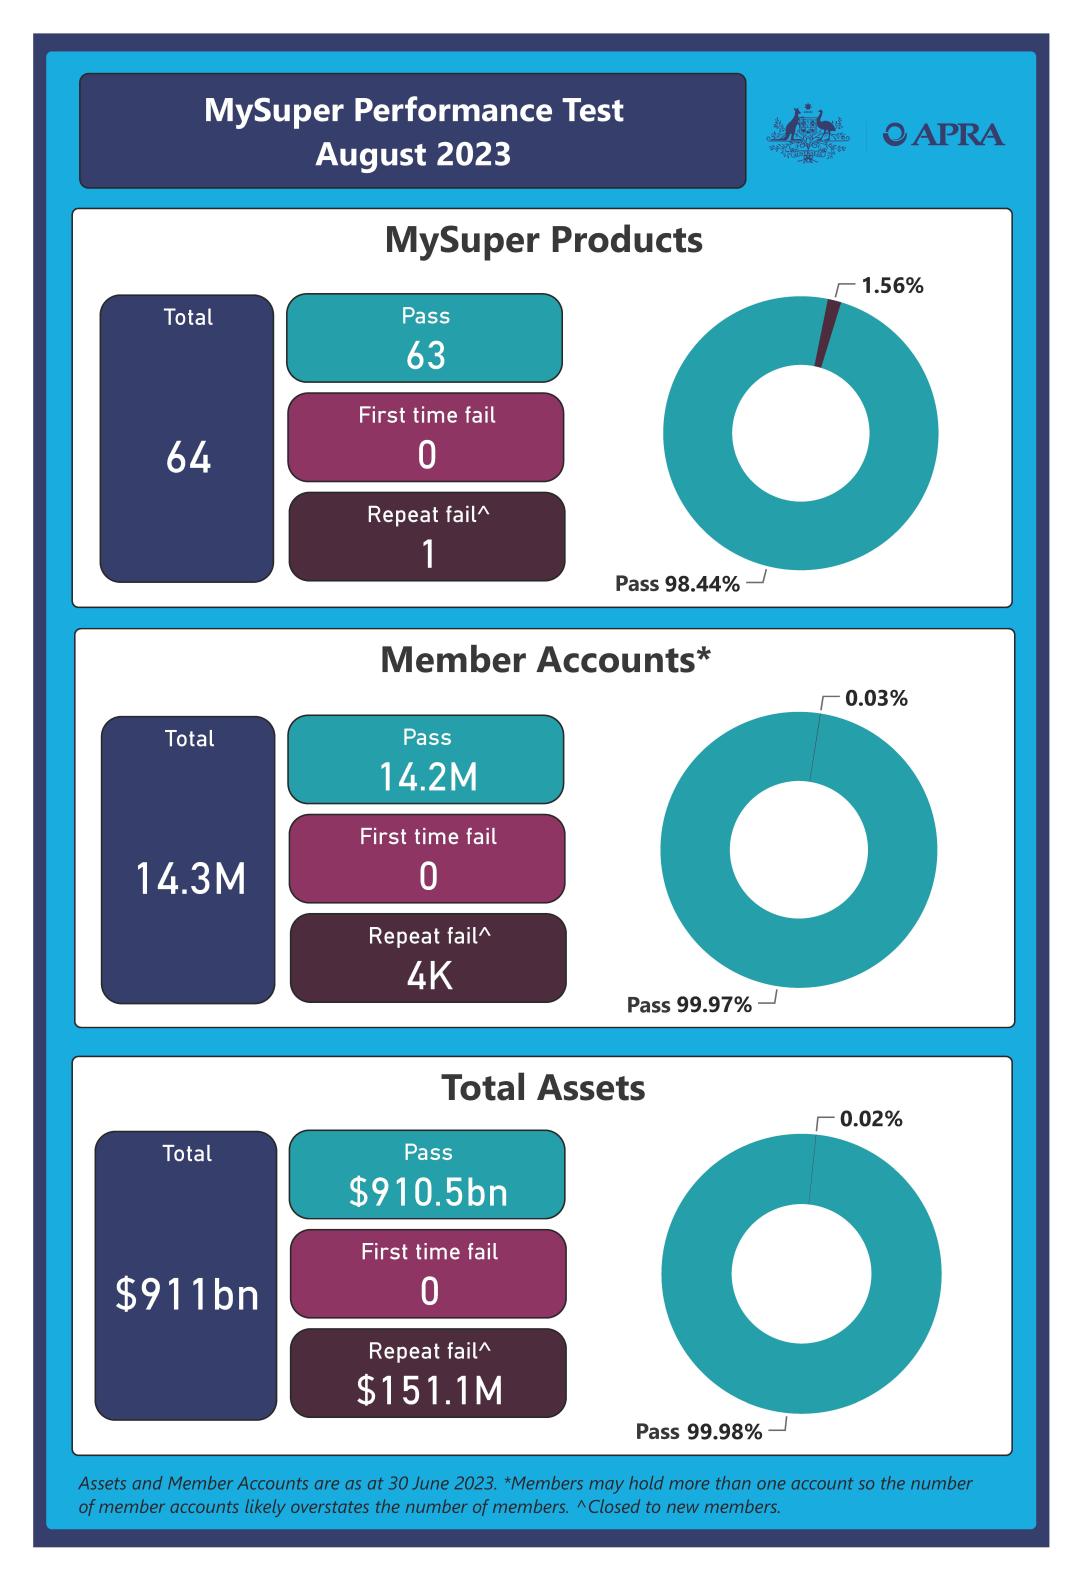 | 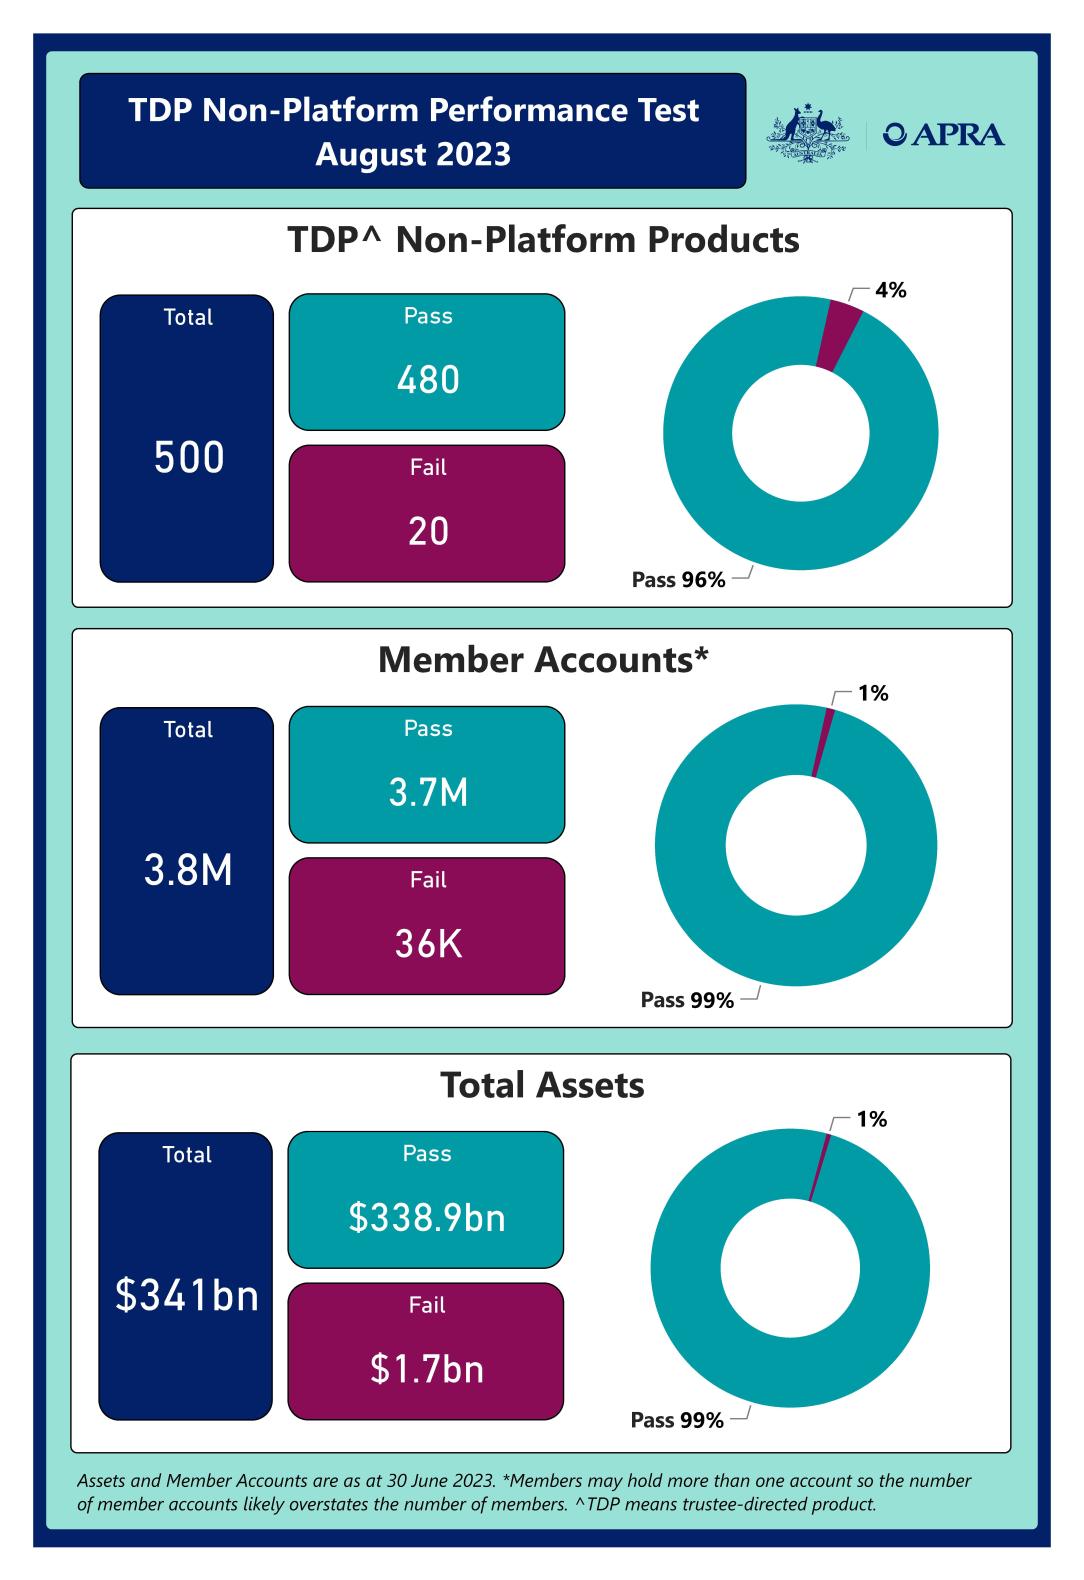 | 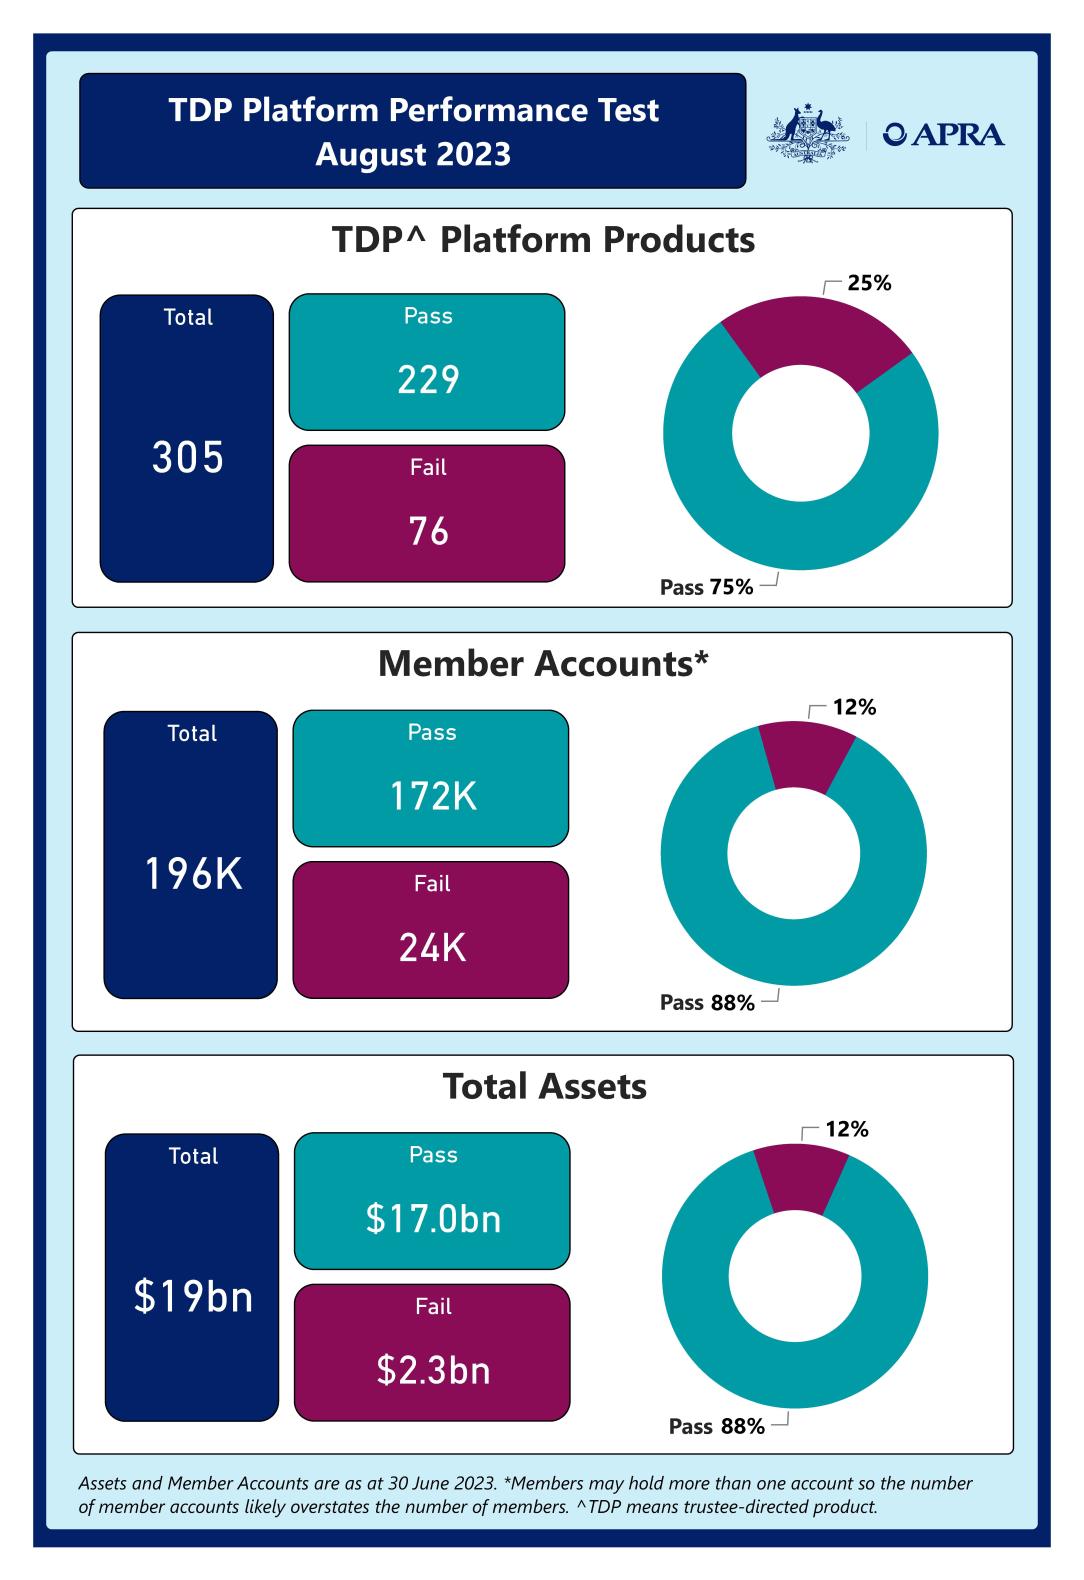 |
| The performance test results for MySuper products released in August 2023 are available here. | The performance test results for trustee directed products released in August 2023 are available here. | The performance test results for trustee directed products released in August 2023 are available here. |
Executive summary
The Performance Test is designed to improve member outcomes by assessing the performance of superannuation investment options against tailored benchmarks. The Performance Test has been in place for MySuper products since 2021 and was extended to Trustee Directed Products (‘TDPs’)1, a subset of the choice sector, in 2023. This paper presents additional insights regarding product performance since the inaugural Performance Test in 2021.
Key findings
There is scope for Registrable Superannuation Entity (‘RSE’) licensees to understand the drivers of their Performance Test results better and the factors contributing to the value they deliver their members through the returns they achieve and the administration fees they charge.
Since its inception in 2021, the Performance Test has had a positive effect on outcomes for members of MySuper products, who are now more likely to have their retirement savings in a better performing MySuper product. Over the past three years, nine failed products have exited the market and average investment performance relative to benchmark has improved.
For the investment component of the Performance Test, the majority of non-platform TDP member accounts equal or exceed their benchmarks, however, the majority of platform TDP member accounts are falling below their benchmarks. RSE licensees with products that consistently underperform their Performance Test benchmarks need to take action to address deficiencies in their investment implementation to improve outcomes for members.
While fees have declined for MySuper products on average, there is scope for RSE licensees to reduce fees further. The scope to reduce fees is larger across TDP offerings; 53,000 member accounts holding $1.1 billion in member assets are currently in TDPs with administration fees more than 0.50 percentage points above the administration fee benchmark. This creates an imperative for RSE licensees to outperform their return benchmarks to pass the Performance Test.
Consistent with previous findings, administration fees tend to be lower for larger funds, demonstrating that benefits of scale exist in the superannuation industry. While some small RSEs can operate efficiently, many cannot. RSE licensees of small and inefficient RSEs should consider what actions they can take to best serve the financial interests of their members, including transferring their members to better performing products or RSEs.
What is the Annual Performance Test?
The legislated Performance Test assesses past performance of three types of investment options: MySuper, non-platform TDPs and platform TDPs. Members in an investment option that fails the Performance Test must be informed of this fact in writing. An investment option that fails for two consecutive years is required to be closed to new members. The Performance Test assessment metric is based on two components:
- an investment return component (‘the investment implementation component’), which assesses the RSE Licensee’s implementation of the investment strategy of the option by assessing the net investment return (‘NIR’) against a tailored benchmark over nine years; and
- an administration fees component, which compares the latest year of administration fees and costs charged to an industry benchmark. For each option, a representative administration fees and expenses (RAFE) measure is determined based on fees over the latest year for a representative member with an account balance of $50,000 and this is compared to a benchmark (‘Benchmark RAFE’ or ‘BRAFE’), which is the median RAFE of all options within each product group (so that there are separate BRAFEs for MySuper, non-platform TDP and platform TDP options).
An investment option fails the Performance Test if its assessment metric is below a threshold of minus 0.50 percentage points per annum.
Key insights
1.1 Investment Performance
While the majority of MySuper and non-platform TDPs are outperforming the investment component of the Performance Test, over half of all platform TDPs are failing to even meet the benchmark.
The Performance Test has led to improved performance across the MySuper product population, with the average performance relative to the benchmark improving since its introduction.
The Performance Test contains an investment performance component that measures the net investment return of a product relative to a tailored benchmark that is created using a product’s strategic asset allocation (SAA). The investment return relative to the tailored benchmark measures how a RSE licensee is delivering value to members when implementing the SAA for a superannuation product.
Investment performance is a major driver of net returns for members. Long-term poor investment performance will be detrimental to the balance that members accrue by retirement.
MySuper Products Investment Performance
Since the Performance Test was first administered in 2021, 17 MySuper products have exited the market2 (Figure 1). Collectively these accounted for $75.5 billion of assets (8.4 per cent of total assets) and 1.4 million member accounts (9.8 per cent of all member accounts) in the MySuper industry as at 30 June 2021. These products exhibited relatively poor investment results and nine of these products had previously failed the Performance Test. The members of these 17 MySuper products have been moved to higher performing MySuper products. In particular:
- the 10 MySuper products that exited in the year ending 30 June 2022 (FY2022) underperformed their investment return benchmark on average by 0.26 percentage points per annum in the 2021 Performance Test (compared with average outperformance of 0.08 percentage points by the 64 products that remained in the market).
- the seven MySuper products that exited in FY2023 underperformed their return benchmark on average by 0.38 percentage points per annum in the 2022 Performance Test. The 58 products that remained in the market outperformed their benchmark by 0.36 percentage points on average.
- MySuper products currently being offered have, on average, achieved significantly better investment performance than those that have exited. The 58 products with sufficient history as at 30 June 2023 outperformed their benchmark return by 0.41 percentage points per annum on average over the nine-year lookback period of the 2023 Performance Test.
Figure 1. Evolution of Investment Implementation Component of Performance Test (MySuper)
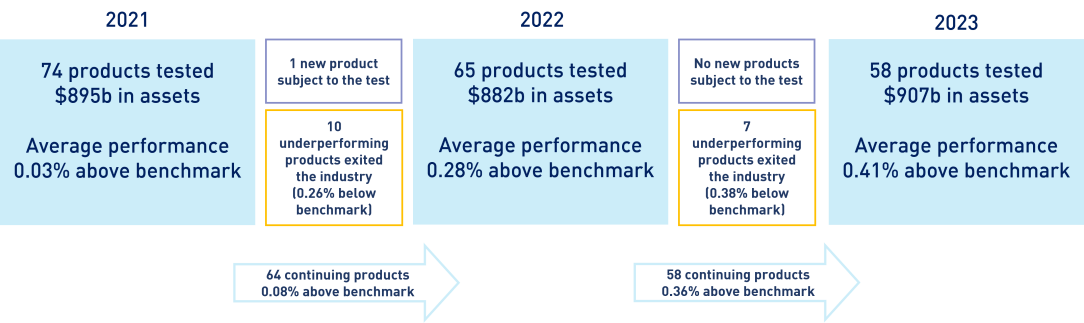
Note: Only includes products with full length of performance history. Benchmark methodology changed between 2022 and 2023.
2023 Performance Test
The MySuper products that remained in the industry have tended to perform quite well, with 80 per cent of member accounts in products that outperformed their tailored benchmark. The remaining 20 per cent of member accounts were in products where the NIR underperformed the benchmark by less than 0.50 percentage points (see Figure 2).
There is a similar experience for members with non-platform TDPs, where 84 per cent of member accounts are in products that outperformed their benchmark. Only 1 per cent of member accounts were in products that underperformed their benchmark by more than 0.50 percentage points.
In contrast, only 44 per cent of member accounts in platform TDPs were in investment options where the RSE licensee outperformed the benchmark. The remaining 56 per cent of member accounts were in products that underperformed the benchmark, with nearly 30 per cent underperforming by more than 0.50 percentage points.
RSE licensees with products that consistently underperform their benchmarks need to understand the drivers of these poor results, and consider what changes are required to improve performance or whether they should advise their members to move to better performing products.
Figure 2. Investment implementation component (% of member accounts)
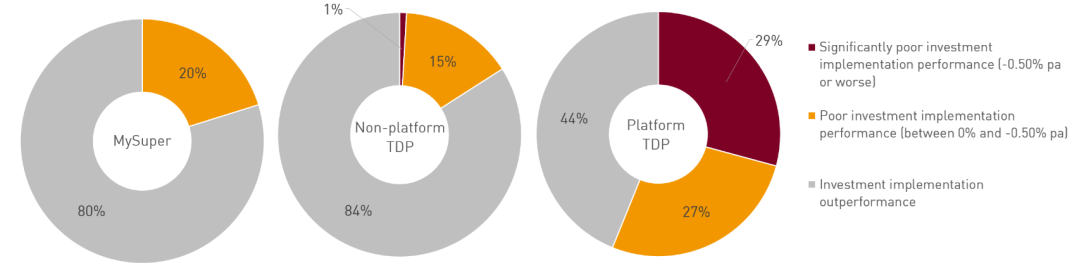
Note: Only includes investment options with a full nine years of performance history (unlike the 2023 Performance Test Dashboards above which cover all options tested, including those automatically granted a pass result due to performance history being less than six years). It is possible for a single member account to have interests across more than one investment option.
1.2 Administration Fees and Costs
Platform TDP fees should be reviewed to ensure the additional services provided justify their higher fees and are providing value for money for members.
RSE licensees should continue to look to reduce fees where possible, however fee reductions should not be at the expense of ensuring products and RSEs remain sustainable.
Administration fees tend to be lower for larger funds, which demonstrates the scale benefits that exist in the superannuation industry.
Superannuation funds charge administration fees to cover the costs of running the fund. Persistently high administration fees and costs erode the balances of members that compound over a long period of time, which will ultimately be detrimental to members’ retirement outcomes.
Dispersion Across Product Segments
There is significant dispersion in the administration fees paid by members within each of the product segments (see Figure 3). The large dispersion in administration fees is evidence that there is considerable scope for fee reductions across the industry, particularly for TDPs.
Representative Administration Fees and Expenses (RAFEs) for MySuper products tend to display less dispersion than for TDPs. This is the result of the legal product structure obligations set out in the Superannuation Industry (Supervision) Act 1993. These obligations include limiting MySuper products to one diversified investment strategy and specifying the types of fees that can be charged3. However, there is still dispersion in the fees charged in the MySuper product segment; the difference between the highest and the lowest MySuper RAFE for 2023 was 0.63 percentage points. Some of this difference reflects the size of the funds as discussed below.
Administration fees for non-platform TDPs offered by RSE licensees that also offer a MySuper product tend to be lower than for those licensees without a MySuper product. This is because many RSE licensees use one product disclosure statement for their MySuper product and non-platform TDPs and apply the same administration fee to these products.
RAFEs for Platform TDPs display substantial dispersion with less similarity in fees charged by RSE licensees across the platform TDP population. The dispersion generally reflects the nature of platform products and the flexibility they provide, with different fees being charged to individual members based on their investment decisions, the services received and the investment menu through which they access the investment option.
Figure 3. Representative administration fees and costs (RAFE) distribution
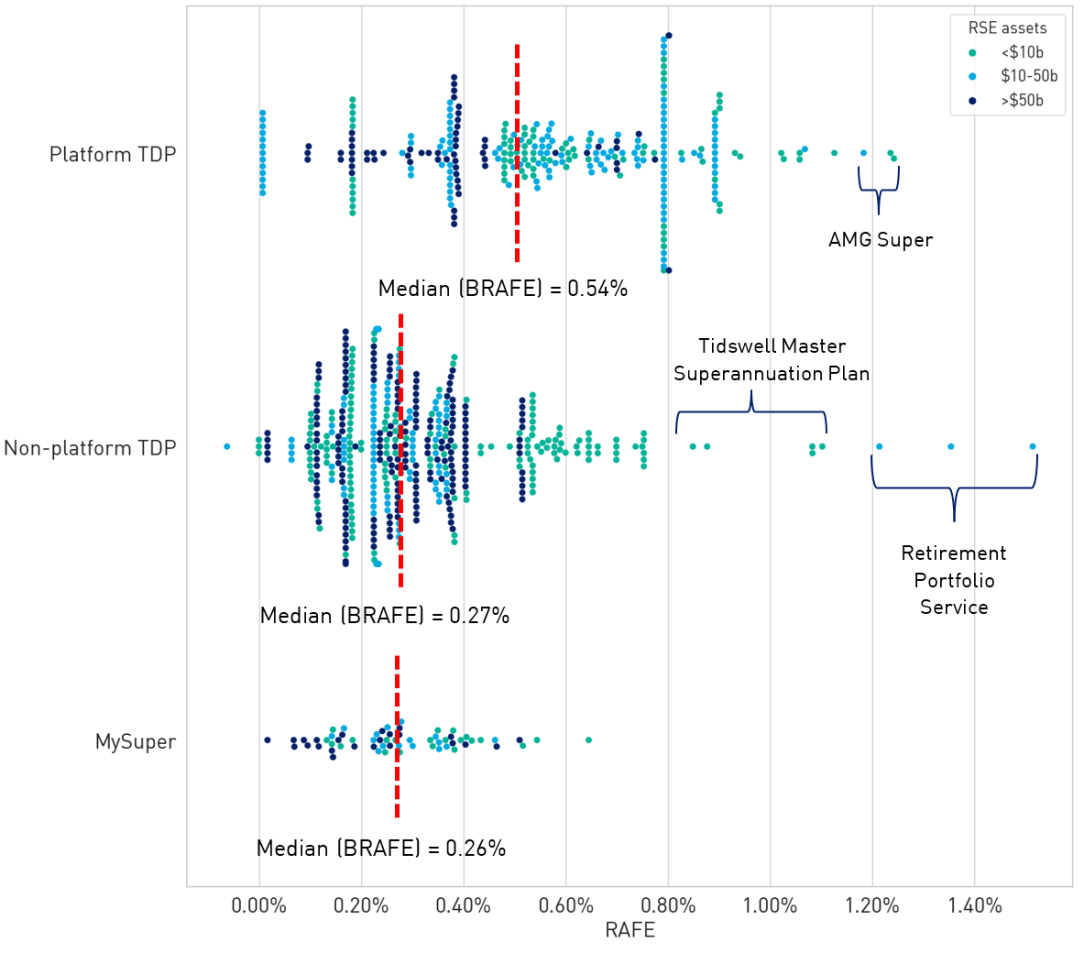
Platform TDPs generally have the highest administration fees with a Benchmark Representative Administrative Fees and Expenses (BRAFE) that is roughly twice that of non-platform TDPs and MySuper products (Figure 3).
While non-platform TDPs had a BRAFE similar to that of MySuper products, there were a number of products that had particularly high administration fees. 53,000 member accounts holding $1.1 billion in assets are currently in TDPs with administration fees more than 0.50 percentage points above their BRAFE.
Some trustees offering platform TDPs may need to review their administration fees to ensure the additional services provided to members justify their higher fees and are providing value for money for members.
MySuper Fees
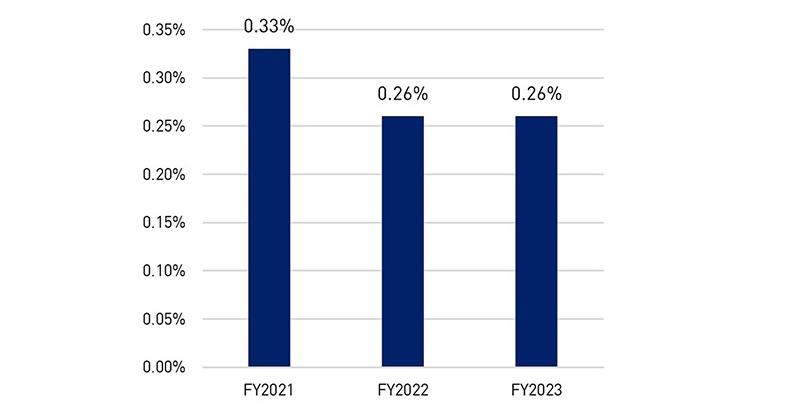
MySuper products are designed to be simple and cost-effective. The BRAFE for MySuper products declined between 2021 and 2022 (see Figure 4). This is a trend that has persisted for several years and reflects competitive pressures and fund mergers4.
Figure 4. Benchmark Representative Administration Fees and Expenses for MySuper
Fee schedules of investment options do not generally change significantly from year to year. Figure 5 compares RAFEs for 2023 with the average administration fees that applied for the first five years of the testing period for each MySuper product that was subject to the 2023 Performance Test. Observations below the diagonal reference line represent products with fees in 2023 that were lower than their average administration fee between 2015 and 2019. Administration fees have generally declined over time, with fee reductions more prevalent among products with higher starting fees. Nevertheless, MySuper products with higher administration fees from 2015 to 2019 still tended to have higher administration fees in 2023.
Figure 5. Administration fee persistency (MySuper)
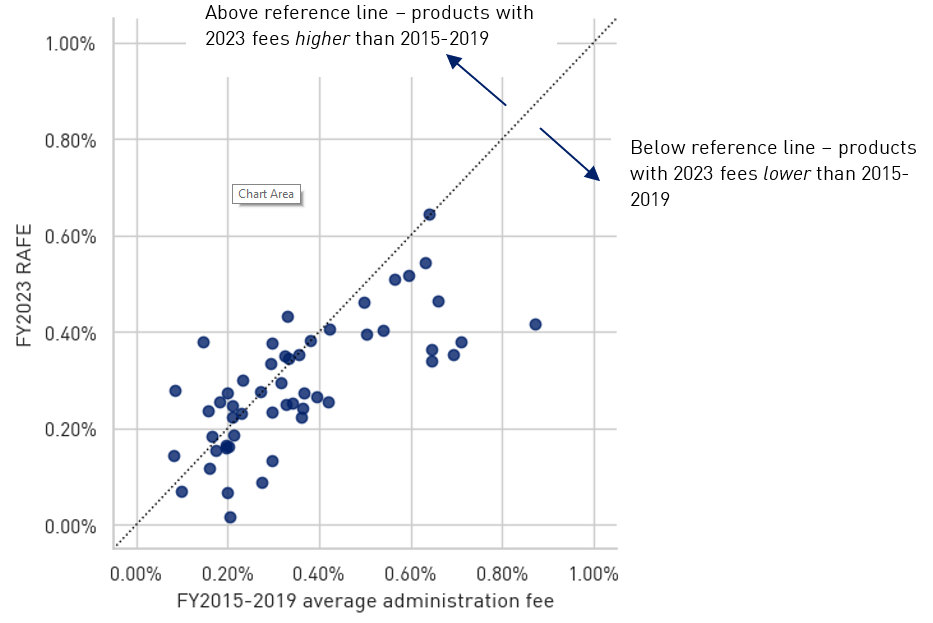
Note: Excludes three products merged from small RSEs into larger RSEs and two products subject to significant temporary fee waivers.
Smaller RSEs tend to have higher fees
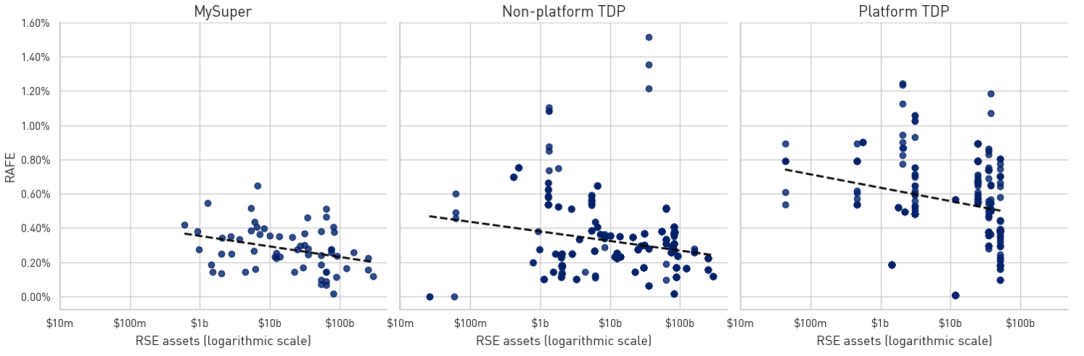
The administration fees component of the 2023 Performance Test suggest that larger funds tend to operate more efficiently and can pass this benefit to members through charging lower administration fees. The panels of Figure 6 plot the option-level RAFE against total assets managed by the offering RSE licensee.
Across all three product segments, there is evidence that options offered by larger RSEs tend to have a lower RAFE than those offered by smaller RSEs, albeit with significant variation5.
Figure 6. Representative administration fees and costs (RAFE) vs RSE size
There are several reasons why larger RSEs could operate at commensurately lower costs and consequently pass on lower fees to members, including:
- fixed costs in administration such as setting up and maintaining IT systems. When administration is outsourced, these may be reflected in the provider’s fee schedule;
- fixed costs in staffing, or similarly, competitive advantages in attracting staff;
- ability to in-source business functions, such as administration or communications. This could result in business functions that can be better tailored to the specific needs of the RSE, and/or avoidance of mark-ups paid to service providers;
- greater bargaining power over service providers for fees and service quality; and
- brand prominence, which can attract members and reinforce other scale efficiencies.
Some drivers of operating efficiency could be unrelated to size. Smaller RSEs could offer greater business agility and more control over governance processes and internal culture.
While larger RSEs are likely to be more efficient than smaller RSEs due to scale, some smaller RSEs may still be able to operate efficiently, as indicated in Figure 6. APRA expects that RSE licensees of small, inefficient RSEs act in members’ best financial interests and consider actions to provide better value to members, or consider whether it is in the members’ interest to be transferred to a more efficient and sustainable offering.
Footnotes
1 Broadly, trustee-directed products are multi-asset products where the RSE Licensee has control over the design of the investment strategy of the product.
2 One additional MySuper product also exited which had a relatively short performance history. It is excluded from the calculations in this paper.
3 Charging rules apply to ensure that members within a MySuper product are charged equitably (see Superannuation Industry (Supervision) Act 2024: Division 5 – Fees rules for MySuper products).
4 See 'Insights paper - MySuper Heatmap 2022' available at MySuper Heatmap - 2022.
5 The negative relationships are statistically significant for MySuper and non-platform TDPs. The statistical significance for platform TDPs is much lower. This segment is concentrated with much fewer RSEs resulting in the vertical clustering of points (representing multiple platform TDP options offered by the same RSE) and this affects the statistical results.