Information paper - Climate risk self-assessment survey
Glossary
ADI | Authorised Deposit-taking Institution |
|---|---|
APRA | Australian Prudential Regulation Authority |
APRA-regulated institutions | Covers authorised deposit-taking institutions (ADI), registrable superannuation entity (RSE) licensee (RSE licensee), general insurers, life insurers and private health insurers. |
Climate risks | Financial risks arising from climate change, including physical (both acute risks associated with extreme weather events; and chronic risks associated with gradual shifts in climate), transition and liability risks. |
CPG 229 | Prudential Practice Guide CPG 229 Climate Change Financial Risks |
CVA | Climate Vulnerability Assessment |
Scope 1 | All direct greenhouse gas emissions arising from a business’ own activities |
Scope 2 | Indirect greenhouse gas emissions from the use of purchased electricity, heat or steam. |
Scope 3 | Other indirect emissions not covered in Scope 2 that occur in the value chain of the reporting company, including both upstream and downstream emissions. Relevant scope 3 emissions for finance sector entities includes the scope 1, scope 2 and material scope 3 emissions from businesses to which they have a financial exposure, or the scope 3 emissions of emissions intensive inputs to their businesses. |
TCFD | Task Force on Climate-related Financial Disclosures (TCFD) |
Executive summary
The effects of a changing climate are wide-ranging, presenting both risks and opportunities to all sectors of the economy, including the financial sector. Given the potentially material and systemic nature of climate change, APRA is committed to ensuring that APRA-regulated institutions take a strategic and risk-based approach to the management of climate risks and opportunities.
Following the release of APRA’s Prudential Practice Guide CPG 229 Climate Change Financial Risks (CPG 229) in November 2021, APRA conducted a voluntary climate risk self-assessment survey (the survey) between March and May 2022. The survey provides insights into the alignment of climate risk practices by medium-to-large APRA-regulated institutions with the expectations set out in CPG 229. The survey responses covered 64 APRA-regulated institutions across the banking, insurance, and superannuation industries.
The participating institutions were asked to respond based on their formally implemented and documented practices at the time of the survey. This information paper provides insights based on the survey (self-assessment) responses; APRA did not validate the institution’s responses to the survey.
Responses show good alignment to CPG 229, but room for improvement
Overall, the survey responses present a picture of reasonable cross-industry alignment to APRA’s guidance on climate change financial risks (Figure 1). Areas reported as having stronger alignment were governance and disclosure, indicating strong engagement from senior management. The survey responses show that boards of most institutions surveyed are overseeing climate risk, and most institutions are publicly disclosing their approach to measuring and managing climate risk, typically in line with the recommendations of the Task Force on Climate-related Financial Disclosures (TCFD).
Figure 1. Average industry scores based on self-reported responses

Survey responses also show that institutions have begun embedding climate risk into elements of the risk management framework and strategic planning. However, climate risk remains an emerging discipline compared to other traditional risk types, with only a small portion of survey respondents reporting that they have fully embedded climate risk across their risk management framework.
An area for improvement is metrics and targets. While many institutions indicated that they measure and monitor climate risks using quantitative or qualitative approaches and set targets, use of more advanced quantitative risk metrics such as scope 3 and financed emissions, and forward-looking exposure to physical and transition risk, was limited.
The survey responses suggest that most institutions are developing quantitative and qualitative climate risk management approaches with equal focus, or with a stronger focus on qualitative aspects (Figure 2). The self-reported responses for the superannuation sector indicated further progress, on average, than for banking and insurance. However, there is a considerable range of maturity indicated in the responses across all industries.
Where institutions are in their early stages of developing their climate risk management practices, the responses show that they initially focus on qualitative aspects such as governance and risk management: this is appropriate, as it ensures that subsequent quantitative climate risk activities are carried out within robust risk and governance frameworks.
Figure 2. Average scores of quantitative and qualitative practices1

Larger institutions’ self-reported responses tend to indicate a more mature climate risk approach
There is a positive correlation in the survey responses between the size of the institution and its maturity in the management of climate risks, with larger institutions consistently scoring themselves higher than smaller institutions in the surveyed group. This likely reflects the investment by larger institutions into understanding climate risk, and potentially other drivers (such as the Climate Vulnerability Assessment2 and reputational drivers) in incentivising action on climate risk.
Beyond just the survey participants, smaller institutions have relatively more concentrated exposures to certain markets, industry sectors or specific geographies that may be impacted by climate change. As such, it is equally important that smaller institutions assess and manage their climate risks.
APRA recognises that assessing and managing climate risk is a complex and resource-intensive discipline and sophisticated climate risk analysis requires strategic effort and investment. However, appropriately proportionate approaches should be considered by all institutions. Where resourcing or capabilities are limited, institutions should consider leveraging qualitative and narrative-driven analysis that are thematically consistent with the better practices outlined in APRA’s guidance. This may initially include incorporating qualitative analysis of the direction of physical climate factors, as well as potential changes in relevant economic, policy, technology, and social factors. Such analysis should be supported by good risk hygiene practices, such as robust governance structures, formal strategic planning and clear roles and responsibilities, which form the foundations of prudent climate risk management for all institutions.
Institutions should continue to evolve their climate risk practices
While the survey responses show there is broad positive alignment to CPG 229 across industries, the understanding of climate change and stakeholder expectations is rapidly evolving. Institutions are increasingly required to continually adapt their own practices in response to the evolving scientific, regulatory and stakeholder landscape.
Disclosure and metrics are areas where investors, standard-setters, and peer regulators are seeking more sophisticated climate risk information. Although the survey responses indicated that many institutions are publicly disclosing their approach to measuring and managing climate risks, the quality and comprehensiveness of disclosures vary, and institutions need to be prepared for rapidly increasing expectations. This includes the growing importance of measuring and disclosing scope 3 financed emissions, which would assist institutions in understanding the potential impacts of climate change on their customers, counterparties, and organisations to which the institution has exposure. These metrics can inform both the risks and opportunities that arise from the transition to a lower-emissions economy, and institutions can benefit from identifying customers, counterparties or organisations that are well positioned to respond to climate change.
Data quality and availability remain a challenge to measuring and monitoring more advanced metrics. However, such challenges should not be used as justification for delay, but rather as a driver for exploring different options that will continue to evolve and mature over time. For example, sectoral or geographic emissions data could be used as a proxy when more granular data is not available, while qualitative narrative-driven analysis and risk scores could also be used.
Footnotes
1 For Figure 2, qualitative refers to a combined score for governance, strategy and risk management, while quantitative refers to a combined score for metrics, targets and disclosure.
2 APRA, Climate Vulnerability Assessment (September 2021), Climate Vulnerability Assessment.
Chapter 1 - Background
In March 2019, APRA released the results from its preliminary survey of climate risk across 38 large institutions in the banking, insurance, and superannuation sectors3. This exercise showed that most of the institutions surveyed were taking steps to better understand climate-related financial risks. At the same time, industry was seeking greater clarity over APRA’s regulatory expectations in relation to climate risk, together with examples of better industry practice.
APRA responded to this feedback by publishing its first cross-industry prudential practice guide, CPG 229 Climate Change Financial Risks, in November 2021.4 CPG 229 provides APRA-regulated institutions with guidance on the prudent management of the risks and opportunities that may arise from a changing climate. The guidance also supports compliance with APRA’s existing risk management and governance requirements outlined in Prudential Standards CPS 220 Risk Management (CPS 220), SPS 220 Risk Management (SPS 220), CPS 510 Governance (CPS 510), and SPS 510 Governance (SPS 510). The financial risks of climate change as described in CPG 229 include physical climate risks, transition climate risks and liability risks (Figure 3). These risks are collectively referred to in this paper as climate risks.
In March 2022, APRA commenced this climate risk self-assessment survey5 to better understand how medium-to-large APRA-regulated institutions aligned with the expectations set out in the guidance.
Figure 3. Climate change financial risks

Survey participation
APRA regulates a diverse range of institutions across banking, insurance, and superannuation industries, and as such a risk-based approach was taken to determine the participants of the climate risk self-assessment survey. The survey was designed for medium-to-large APRA-regulated institutions that are categorised as a Tier 1 or Tier 2 entity under APRA’s Supervision Risk and Intensity (SRI) Model.6 These institutions have been identified as having a greater systemic impact on the financial system based on key indicators including the entity’s size, interconnectedness, substitutability, and complexity.
Some institutions provided a group level response to the survey, with each response covering multiple APRA-regulated institutions within the same group7. Overall, 60 responses were received covering 64 individual Tier 1 and Tier 2 APRA-regulated institutions: the survey results in this paper relate to the 64 APRA-regulated institutions.
Of the individual institutions that participated in the survey, 41 per cent were insurers (with general insurers accounting for half of all insurer responses), 33 per cent were authorised deposit taking institutions (ADIs), and 27 per cent were superannuation trustees (Figure 4).8 This represents 81 per cent of Tier 1 and Tier 2 APRA-regulated institutions. The institutions varied in size and complexity, ranging from medium-to-large Australian domestic institutions, as well as foreign institutions with an Australian operation under APRA jurisdiction.
Figure 4. Participation by industry

Figure 5. Average score by institution size

Overall, the survey responses show there was a positive correlation between the size of the institution and maturity of climate risk practices. This broadly indicates that larger and more complex institutions have assessed themselves as having more advanced capabilities, commensurate with their resourcing, in managing climate risks. At an industry level, the banking sector responses showed the strongest correlation between size and maturity, while medium sized superannuation institutions reported better self-assessments of maturity than both larger and smaller institutions within the surveyed group (Figure 5).
Given the voluntary nature of the survey, it may be that institutions which are more invested in the management of climate risks are more likely to have responded to the survey, and that this may be reflected in the overall survey outcomes at cross-industry and industry levels. APRA also notes that there will be differences in the way individual institutions self-assess the maturity of their own practices. As noted above, this information paper provides insights based on the survey (self-assessment) responses; APRA did not validate the institution’s responses to the survey.
Survey format
The survey largely comprised qualitative multiple-choice and limited-choice questions with predetermined response options. This approach was adopted to minimise regulatory burden on the institutions participating in the survey, while still meeting APRA’s supervisory requirements. The institutions were provided the opportunity to include additional explanations for a limited set of questions, and a small number of industry specific questions were included in the survey.
This paper presents results from individual questions, together with results that have been aggregated across multiple questions using a scoring framework to reveal the degree of alignment to CPG 2299.
A copy of the full survey questionnaire is included in Attachment A. APRA encourages APRA-regulated institutions that were not in scope for this survey to consider the questions in the survey in reviewing and developing their own practices.
Footnotes
3 APRA, APRA to step up scrutiny of climate risks after releasing survey results (March 2019), APRA to step up scrutiny of climate risks after releasing survey results.
4 APRA, Prudential Practice Guide CPG 229 Climate Change Financial Risks (November 2021), APRA finalises prudential guidance on managing the financial risks of climate change.
5 APRA, Climate risk self-assessment survey (March 2022), Climate risk self-assessment survey.
6 APRA, Supervision Risk and Intensity (SRI) Model (November 2020), Supervision Risk and Intensity (SRI) Model.
7 Where an APRA-regulated institution is part of a group, and it addresses climate risk with respect to that institution and its activities using a common group framework, the institution was permitted to respond to the survey questions according to the group framework. However, the group framework must be relevant to the APRA-regulated institution(s) and its activities.
8 Due to rounding, the percentages reflected throughout this paper may not always total to 100 per cent.
9 The scoring framework assigned a value to each answer using a 0-to-100 scale, where a score of zero represents no alignment to CPG 229 and a score of 100 represents the most mature practice in alignment to CPG 229. A small proportion of questions were excluded from the scoring framework as they did not align to this scoring approach.
Chapter 2 - Governance and strategy
Overall, institutions reported robust climate risk governance but integrating climate risk into strategic planning has some way to go
- Four out of five boards (or board committees) report overseeing climate risk on a regular basis.
- In line with better practice, responses showed that 77 per cent of boards have undertaken training on climate risk, and over 80 per cent of institutions have provided climate risk training to staff.
- Over a third of institutions (36 percent) report that they do not have defined roles and responsibilities related to the management of climate risks across any functions.
- Just under two-thirds of institutions (63 per cent) report that they have incorporated climate risk into their strategic planning process, of which half have incorporated the short-, medium- and longer-term impacts of climate risk. At the same time, just under a third of institutions report they are yet to incorporate climate risks into strategic planning.
Figure 6. Average governance and strategy scores

Board oversight
Board-level engagement is an important component in ensuring climate risk has sufficient focus within an APRA-regulated institution. The extent and frequency of oversight will vary by institution: a prudent board will consider the nature and magnitude of the risks to which the institution is exposed when tailoring its approach.
The survey responses showed strong board-level engagement. Overall, 80 per cent of the institutions responded that their board or board committee oversee climate risk on a regular basis, with ADIs reporting a slightly lower rate of regular board-level climate risk oversight, while insurers reported a higher-than-average rate (Figure 7).
Oversight on a bi-annual or more frequent oversight was most common, accounting for 67 per cent of all responses, while another 19 per cent oversee climate risk on an ad hoc basis. Overall, the responses show that almost all boards oversee climate risk to some degree.
Roles and responsibilities
As with other risks, effective delegation is an important part of ensuring day-to-day management of climate risk in an institution. The survey responses show that three quarters of the institutions’ boards (75 per cent) have formally delegated the management of climate risk to senior management positions and/or a management committee (Figure 8). Given almost all institutions have indicated that the board oversees climate risk to some degree, it was expected that more boards would have formal delegations in place to ensure clear responsibilities are established, which in turn can be used to monitor the exercise of the delegated authority. The superannuation sector was an exception, with close to 90 per cent of institutions indicating formal delegations are in place.
Leading practice of defining roles and responsibilities for climate risk management across business lines, independent risk, and assurance functions (i.e., all three lines of defence) was most common in the responses from insurance and superannuation sectors (Figure 9). At the same time, over one-third of institutions (36 per cent) reported they have not defined roles and responsibilities across any risk functions. Overall, this suggests that this is a relatively less mature area, and APRA considers it appropriate for institutions to formally articulate functional roles and responsibilities as a matter of good practice.
Figure 7. Frequency of board oversight

Figure 8. Extent of board delegation to senior management

Figure 9. Defined roles & responsibilities across the three lines of defence

Training
It is appropriate for institutions to consider whether they hold the necessary skills and capabilities to understand and manage climate risk, and whether training is needed for board members and relevant staff. Examples of training may include in-person or online sessions, seminars, and workshops or roundtables facilitated by internal or external parties.
In line with better practice, 77 per cent of the institutions surveyed responded that their board, or a subset of their board, have undertaken training in relation to climate risk (Figure 10). Some 58 per cent of institutions that have provided the board with training have done so in the last 12 months, suggesting a growing recognition of the importance of board familiarity with respect to climate risk issues. Further, 42 per cent of institutions responded that climate risk has been considered in the composition of the board, with one or more members of the board having expertise or experience in climate risk specifically or environmental, social and governance (ESG) risks (or similar) more broadly.
At the staff-level, 80 per cent of institutions surveyed responded that climate risk training has been provided to a target group of staff (Figure 11). Training participants ranged from individuals, such as the Head of Sustainability or similar, to entire functions. The groups most likely to receive training were executive level management, independent risk management functions and front-line business teams such as underwriting, investment and business/institutional banking teams in the insurance, superannuation, and banking industries respectively. Leading institutions also provided optional or mandatory training to all staff, typically through online modules.
Figure 10. Climate risk training undertaken by the board, or a subset of the board

Figure 11. Extent of staff provided climate risk training

Strategy
While there is some uncertainty over impact pathways for climate risks in the financial sector, it is likely that impacts will extend beyond typical business planning cycles. As such, a prudent institution should take both a shorter-term view that is consistent with the institution’s regular planning horizon, as well as a longer-term view to account for potential structural changes in the transition to a low carbon economy and potential changes in the physical landscape.
Just under two-thirds of institutions (63 per cent) reported having incorporated climate risk into their strategic planning process (Figure 12), of which half indicated they have incorporated the short-, medium- and longer-term impacts of climate risk.
At the same time, the responses show an overwhelming focus on the shorter-term impacts of one-to-five years especially for the banking and insurance sectors where 58 percent and 46 percent of institutions respectively reported to consider the shorter-term impacts only. This suggests that the consideration of climate risk impacts is being aligned to existing business planning horizons or potentially aligned to the scope of capital planning horizon for banking which typically covers a similar period.
The survey responses included examples of institutions having set climate-related targets that extend to 2030 and 2050, such as net zero emissions commitments (see Chapter 4 on metrics and targets), without considering the medium- to long-term climate risk impacts in their strategic planning. At a minimum, these institutions should formally consider the longer-term climate risks, and how those risks may impact the institution’s plan to achieve its targets and commitments.
Examples of substantive changes to business strategy in response to the impact of climate risks include:
- investing in capabilities to manage climate risks, including data and modelling;
- integrating climate risk into governance, risk appetite and policies;
- adjusting the product offering or portfolio mix;
- engaging customers and investees to support transition; and
- reducing emissions in direct operations.
Figure 12. Extent of climate risk impacts incorporated in strategic planning

Chapter 3 - Risk management
Climate risks are being incorporated across the risk management framework to varying degrees
- Over 80 per cent of institutions reported having a formal process in place to identify material climate risks. However, only half of these institutions reported assessing the potential impact of climate risk on their institution on a regular basis.
- Responses showed that climate-related scenario analysis is conducted by 72 per cent of institutions.
- Institutions reported having started to embed climate risk into elements of the risk management framework to varying degrees. The most progressed elements include management reporting and information systems, and governance structure and composition.
- Almost 90 per cent of institutions indicated they have sought assistance from external experts or bodies on climate risk.
- In general, the responses show that institutions consider that they have moderate vulnerability to both physical and transition risks under a high-risk scenario, and they consider these risks to be within an acceptable range for the institution’s current risk appetite.
Figure 13. Average risk management score

Risk management framework
The survey responses reveal that institutions have started to embed climate risk into elements of their risk management framework, and 79 per cent have recognised climate risk in their risk taxonomy / risk register (Figure 14). However, institutions are at various stages of maturity, with only a small portion of institutions reporting they have fully embedded climate risk across their risk management framework in a manner equivalent to other existing risk types.
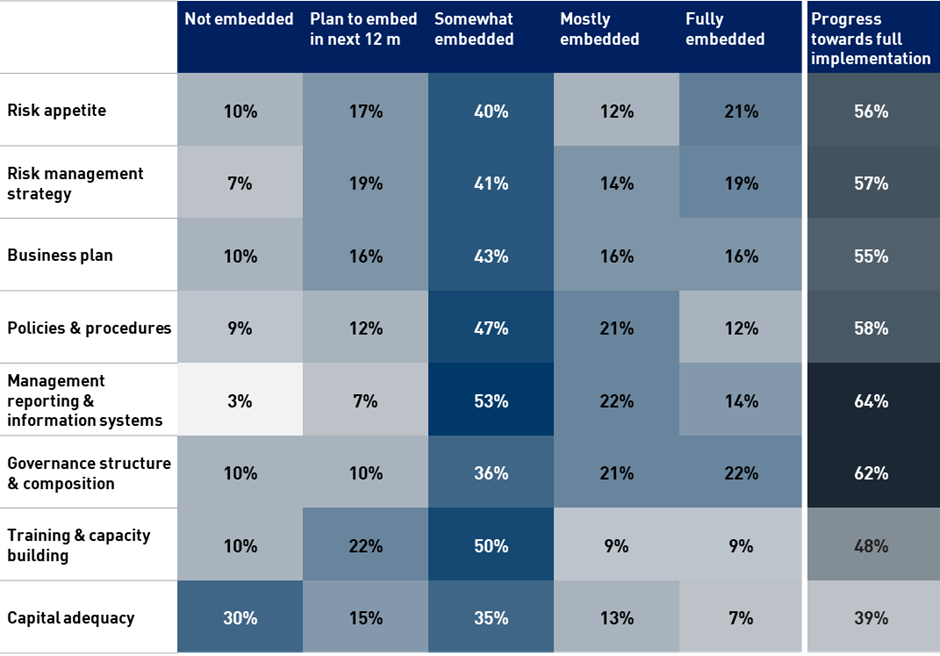
The responses indicate that the strongest framework elements that have most progressed towards full implementation are management reporting and information systems, and governance structure and composition (Figure 15). The least progressed areas were capital adequacy (for relevant institutions) and training and capacity building. The latter indicates that while institutions are providing climate risk training as described in Chapter 2, the training approach or capabilities are not necessarily aligned in the same way as other risk types in the institution’s risk management framework. While the results shown in figure 15 present a cross-industry view, individual industries follow a similar pattern of maturity across each framework element.
Around 90 per cent of institutions reported seeking assistance from external experts or bodies on climate risk. Specialist consultants and academic experts/institutions were most commonly called on to assist institutions. Some institutions also leverage ESG-focused rating agencies, climate-related data providers, and community organisations such as emergency services organisations to better understand climate risks.
Figure 14. Climate risk treatment in risk taxonomy / risk register

Figure 15. Heatmap of climate risk integration in risk management framework elements
Risk identification
A prudent institution would identify and assess material climate risks for the institution. More than 80 per cent of institutions reported having a formal process in place to identify material climate risks (Figure 16).
However, only 48 per cent of institutions reported having assessed the potential impact of climate risk on a regular basis (Figure 16). At an industry level, superannuation responses indicated most progress, with 75 per cent of institutions responding that they assess climate risk on a regular basis. This was almost four times the rate in banking (18 per cent). Institutions that have incorporated climate risk as part of their regular risk assessment processes will be better placed to respond to evolving climate risks and ensure that the institution’s risk management framework is commensurate to the risk.
Scenario analysis
CPG 229 includes guidance on shorter- and longer-term scenario analysis as a useful tool for informing the risk identification process. Climate-related scenario analysis and broader climate vulnerability assessments and stress testing are developing areas; even so, the survey responses indicated that 72 per cent of institutions undertake climate-related scenario analysis. A majority of those institutions have undertaken three or more climate-related scenario analyses (Figure 17).
The most common climate scenarios used included:
- Intergovernmental Panel on Climate Change (IPCC) Representative Concentration Pathway (RCP) 2.6, RCP 4.5 and RCP 8.5;
- Network for Greening the Financial System (NGFS) Current Policies (Hot House World) Scenario, and Delayed Transition (Disorderly) Scenario; and
- International Energy Agency (IEA) Net Zero Emissions (NZE) by 2050 Scenario, Stated Policies Scenario (STEPS) and Sustainable Development Scenario (SDS).
Some institutions have also developed their own scenarios, or referenced APRA’s Climate Vulnerability Assessment, which is based on the NGFS scenarios with additional modelling for the Australian context.
Figure 16. Extent of climate risk identification and assessment

Risk factors
The surveyed institutions reported that they consider a range of risk factors when evaluating the potential climate risks faced by the institution’s customers, counterparties, investments and/or assets. The factors that are most widely considered included physical risk factors (such as vulnerability to extreme weather events), and transition risk factors (such as potential exposure to changes in climate-related policy, technology development or changes in customer expectation).
Some institutions also indicated that they consider the climate-related governance and risk management practices, and reputational factors, of their individual customers, counterparties, investments and/or assets, as well as broader sectoral assessments. These factors may be used to develop a climate risk profile, which could then be used as part of undertaking business engagements such as investing, insuring or lending.
Figure 17. Extent of climate risk scenario analysis undertaken

Vulnerability to physical, transition and liability risks
To determine appropriate treatment of climate risk in an institution, it is good practice to form a view of the current and future vulnerability to physical, transition and liability risks posed by climate change in high-risk scenarios.
Just under a quarter of institutions (22 per cent) indicated they are unsure of their vulnerability to physical and transition risks. While sophisticated analysis of such risks using reputable and accessible data may be challenging for some organisations, CPG 229 provides guidance on other tools that may be used, such as more narrative-driven analysis. These tools can support institutions that are undertaking such analysis for the first time or have limited resources.
Of the institutions that reported having assessed their vulnerability to high-risk scenarios, moderate vulnerability to both physical risk under a high-emissions scenario, and transition risks under a disorderly scenario were most reported. These risks were generally considered to be within an acceptable range in relation to the institution’s current risk appetite (Figure 18).
There were a small number of institutions that indicated that they are highly or extremely vulnerable to physical climate risks, with the risk considered close to or beyond the maximum level of acceptable risk based on the institution’s current risk appetite. The most frequently cited physical risk impacts were on credit risk (banking), pricing risk (insurance) or investment performance (superannuation).
Figure 18. Vulnerability to high-risk physical and transition risk scenarios

For liability risk, 67 per cent of respondents reported they have considered potential liability originating from clients, counterparties, members, or other stakeholders (Figure 19). There is variation between industries, with 88 per cent of superannuation respondents showing concern for liability risk, followed by insurance (62 per cent) and ADIs (57 per cent). Liability risk is a rapidly evolving area and can stem from the potential for ligation where institutions and boards do not adequately consider or respond to the impacts of climate change, having implications for businesses and director’s duties.
Business continuity
Almost 40 per cent of institutions responded that climate-related events could have a material or moderate impact on their direct operations, and that business continuity plans have been, or will be, adapted (Figure 20). Banking had the greatest proportion of survey responses that ranked the impacts of climate risk on direct operations as material or moderate. This may be due to the geographical spread of banks’ branch networks and support services, which broadens the scope for potential impact from climate-related events.
Over half of the institutions surveyed reported that there is little to no business continuity impact from climate risk, and as such they have not made any substantive changes to existing business continuity plans. Another 8 per cent have not considered the impacts to business continuity at all. For institutions that have not considered such impacts or sought to enhance their current understanding: the potential impacts from outsourcing arrangements, service providers and supply chains should be considered for a comprehensive view of the resilience of the institution’s direct operations.
Figure 19. Extent of liability risk considered

Figure 20. Extent of climate-related events impacting business continuity

Chapter 4 - Metrics and targets
Metrics and targets are being developed for climate risk, but remain at an early stage
- Half of the institutions (50 per cent) responded that they have both qualitative and quantitative approaches to measure and monitor climate risks, with more superannuation institutions reporting using both qualitative and quantitative approaches.
- At the same time, 23 per cent of institutions indicated that they don’t have any metrics to measure and monitor climate risks.
- A third of institutions (33 per cent) reported that they do not assess emissions arising from their wholesale lending (banking) and investments (insurance and superannuation), with banking having the highest proportion of non-assessment (close to 50 per cent).
- Coverage of relevant scope 3 emissions assessed was very low in institutions’ wholesale10 lending or investment portfolios.
- Almost three-quarters of institutions (73 per cent) reported having one or more climate-related targets in place.
Figure 21. Average metrics and targets score

Metrics
Effective measurement and monitoring of climate risks should be supported by metrics that are appropriate to an institution’s size, business mix and complexity. Half of the institutions (50 per cent) responded that they have both qualitative and quantitative approaches to measure and monitor climate risks with more superannuation institutions reporting use of qualitative and quantitative approaches (82 per cent), compared to insurers (42 per cent) and ADIs (33 per cent) (Figure 22).
At the same time, almost a quarter of institutions responded that they don’t have any metrics to measure and monitor climate risks; however, most of these institutions have indicated that they plan to develop metrics in the next 12 months. This suggests that this is an area of focus for the next year as many institutions build their internal capabilities and frameworks to support quantitative and qualitative measures of climate risk.
Of the institutions using quantitative metrics, there was a mixture of transition and physical risk measures being used for the institution’s direct operations and financing activities. Most common were metrics related to scope 1 and 2 emissions from the institution’s operations; physical weather-related metrics; financial exposures in certain sectors and geographies; portfolio emissions intensity; and financing of renewables and transition projects.
Measurement of financed emissions
Measuring scope 3 financed emissions allows institutions to understand the potential current and future transition risks arising from their customers and counterparties, as well as organisations to which the institution has financial exposures. There is also growing awareness of the role that financial institutions’ lending and investment decisions play in supporting the transition to a low emissions economy. As a result, investors, standard-setters, and peer regulators are seeking broader and more sophisticated climate risk information on financed emissions metrics. Institutions should continue to develop and enhance their practices to meet these evolving expectations, particularly where they rely on access to international capital markets.
Close to two-thirds of institutions (67 per cent) reported having assessed the emissions arising from their wholesale lending (banking) and investment (insurance and superannuation) portfolio to some degree, with superannuation having the largest proportion of institutions (88 per cent) responding that they have assessed emissions arising from their investment portfolio (Figure 23). At the same time, a third of institutions (33 per cent) reported having no such assessment, with banking having the largest proportion of institutions (48 per cent) reporting that they have not assessed the emissions arising from their wholesale lending portfolio.
Figure 22. Approaches to measure and monitor climate risks

Figure 23. Assessment of emissions arising from wholesale lending (banking) and investments (insurance and superannuation)

While 67 per cent of surveyed institutions reported having assessed the emissions arising from their wholesale lending or investment portfolio, the responses show the coverage of relevant scope 3 emissions assessed was generally low (Figure 24).
- Counterparty or investment level assessments were most common, with 66 per cent of institutions reporting they perform this assessment. This was predominantly driven by the superannuation sector, which had greater reporting of investment-level emissions assessments.
- Sector level emissions assessments were the next most commonly used (48 per cent). This was driven by the banking sector’s greater reporting of sector level emission assessments.
The survey responses show that while institutions are starting to measure the relevant scope 3 emissions arising from their financing activities, the assessments appear to be a targeted effort to understand small areas of the portfolio, and not yet adopted broadly across the portfolio.
Scope 3 emissions assessments can be complex and resource intensive. While ongoing work supporting data quality and availability will improve access to scope 3 insights over time, investing in the capabilities to measure and monitor these metrics now will position institutions as leaders in climate risk management. In this way, institutions may augment counterparty/investment-specific data with sectoral or geographic emissions data to support scope 3 assessments or leverage qualitative narrative-driven analysis and risk scores.
Figure 24. Proportion of wholesale lending (banking) and investments (insurance and superannuation) that have assessed relevant scope 3 emissions

Financial impacts of forward-looking physical and transition risks factors
The survey asked institutions to estimate the proportion of their financial exposure for which the impact of forward-looking physical11 and transition12 risk factors has been assessed.
The financial impacts of physical and transition risks in wholesale lending and investments were assessed by a majority of survey respondents, with 54 per cent of institutions reporting having assessed physical risk and 61 per cent reporting having assessed transition risk (Figure 25). While these assessments were typically at the counterparty or investment level, coverage was typically low: the most common coverage was less than 25 per cent of their exposure. A similar pattern was shown in the mortgage lending exposures for ADIs (not shown), although there was slightly more coverage of physical risk factors at the address and post-code levels.
The responses indicate that most institutions have started to assess forward-looking physical and transition risks: however, these assessments typically cover small parts of their portfolios. APRA’s own engagement with the international investor community has shown that investors are evolving their risk metrics to a more forward-looking stance and APRA-regulated institutions should consider advancing their own metrics to account for future trends and pathways, in addition to using historical data.
Figure 25. Proportion of wholesale lending (banking) and investments (insurance and superannuation) that have assessed the financial impacts of physical and transition risks

Targets
Meaningful targets can be a powerful tool to articulate the outcomes that an institution wants to achieve, over a defined time-horizon. Overall, 73 per cent of institutions reported having one or more climate-related targets in place (Figure 26). Superannuation had the largest proportion of institutions reporting having set targets (82 per cent), followed by insurance (77 per cent) and banking (62 per cent). Almost all institutions that have not set climate-related targets have indicated that targets will be developed within the next 12 months.
Targets were largely aligned to the institution’s metrics, and align to one of the following groupings:
- Direct operational emissions targets, including reductions in operational scope 1 and 2 emissions, achieving operational net-zero over a defined time frame, or increasing the use of renewable energy.
- Financed emissions targets, such as reducing lending exposures to, or divesting from, emissions intensive sectors.
- Risk-based targets related to credit risk scoring or uplifting internal risk capabilities such as expanding their coverage of climate-related scenario analysis.
- Engagement targets, such as increasing engagement with counterparties, customers, and investees in assessing or supporting their transition efforts.
Most institutions that have established targets review them regularly (e.g., annually) in line with APRA’s CPG 229 guidance, or have identified circumstances that act as a trigger for review. Examples of circumstances that may trigger a review include outcomes from internal climate change scenario analysis, scientific developments, changes in national targets or policies, industry benchmarking and customer and investor engagements.
Figure 26. Extent of climate-related targets in place

Footnotes
10 For the purposes of the survey, wholesale lending exposure included commercial and/or institutional lending.
11 Physical risk assessments include forward-looking physical risk factors such as heat stress, wildfires, floods, cyclones and sea level rises.
12 Transition risk assessments include forward-looking transition risks such as changes in climate-related policies, technology innovation and customer sentiment, and/or quantifying the impact of adaptation measures.
Chapter 5 - Disclosure
Climate-related disclosures aligned to the recommendations of the TCFD are common
- Over two-thirds of institutions(69 per cent) reported having publicly disclosed their approach to measuring and managing climate risks.
- Of these institutions, almost 90 per cent reported having aligned their disclosure to the TCFD framework.
Figure 27. Average disclosure scores

Climate risk disclosures are common across industries, with 69 per cent of institutions responding that they publicly disclose their approach to measuring and managing climate risks. Of these, 41 per cent responded that they also disclose metrics and targets that their institution has set for itself or set using an independent process or framework.
Of the institutions that do provide climate risk disclosures, almost 90 per cent reported having aligned their disclosure to the TCFD framework and almost all the remaining institutions indicating that they are planning to align their disclosure to the TCFD framework in the next 12 months. At the industry level, banking had the highest proportion of institutions that reported aligning with the TCFD framework (93 per cent), followed by superannuation (85 per cent) and insurance (81 per cent). While the responses indicate wide-scale adoption of the TCFD framework, it is important to note that the scope and quality of information disclosed by APRA-regulated institutions varies. Some institutions focus on qualitative disclosures on direct and supply-chain related operations, while others have adopted more sophisticated disclosures on quantitative financed emissions and forward-looking analysis.
There is an increasing recognition of the role financial institutions’ financing decisions play in the transition to a low emissions economy. As a result, there is greater attention on not only the impacts of climate risk on the institution’s own direct operations but also whether the institution’s lending and investment portfolios are consistent with the Paris Agreement. As discussed in Chapter 4, this includes measuring and disclosing emissions that the institution has direct control over, and also scope 3 financed emissions.
Chapter 6 - Outlook
Global response to climate risks
International and domestic agencies are actively taking steps to integrate climate risk into their industry and supervision priorities, bringing climate risk to the forefront of financial regulation and standard setting. The Basel Committee on Banking Supervision, drawing from existing supervisory initiatives undertaken by prudential authorities and international bodies, has recently published its Principles for the Effective Management and Supervision of Climate-related Financial Risks13. The principles form part of the broader approach to addressing climate-related financial risks to the global banking system.
Beyond banking, various disclosure regimes are also progressing in 2022, with both the International Sustainability Standards Board14 (ISSB) and the US Securities and Exchange Commission15 having published exposure drafts for proposed rules to enhance and standardise climate related disclosures. New Zealand has also passed legislation on making climate-related disclosures mandatory for some organisations16. The value of credible and comparable climate-related disclosures in line with international standards is also gaining recognition domestically.17
As disclosure regimes evolve internationally and domestically, the Australian Securities and Investments Commission (ASIC) is also focusing on greenwashing issues to ensure that product and corporate disclosures on climate and broader sustainability-related risks and opportunities are not misrepresented.18
In addition to these developments is the evolving concept of insured emissions, or the release of greenhouse gases enabled by insurance underwriting. The Partnership for Carbon Accounting Financials (PCAF) is actively working with the insurance industry to develop calculation methods, and it is likely that expectations to disclose such information will follow.
The demand for reliable, timely and sophisticated climate risk measures and their disclosure is likely to increase over time. APRA-regulated institutions must ensure they understand and manage the risks and opportunities that climate change presents for the institution; prudent governance and risk management practices that are supported by meaningful metrics will better enable institutions to measure and monitor climate risks and assess opportunities.
Integrating climate risk into supervision
The responses to this climate risk self-assessment survey have assisted APRA in understanding the views of responding institutions on the alignment of their management of climate-related financial risks with APRA guidance. While the responses overall indicated broad alignment with CPG 229 across the industries, there are areas for improvement at both industry and individual institution levels. The insights from the survey responses will be integrated into supervisory activities in accordance with APRA’s risk-based supervision model.
APRA expects institutions to evolve their climate risk management practices in response to developments in climate-related science, data, and stakeholder expectations. A future survey of this kind will be considered as a tool to monitor how APRA-regulated institutions are evolving their approach over time. The benefits of expanding future surveys to all APRA-regulated institutions will also be considered, as this would provide a more holistic view of the approaches being taken. This includes understanding how smaller institutions (that may have greater exposure to material climate risks due to their concentration in a particular market, sector or geographical location) are responding to climate change financial risks and opportunities.
In line with APRA’s Supervision Priorities19, APRA will be seeking to develop additional tools to evaluate climate-related financial risks and increasing its scrutiny of institutions’ progress in addressing the impact of climate risk.
Footnotes
13 Basel Committee on Banking Supervision, Principles for the effective management and supervision of climate-related financial risks (June 2022), https://www.bis.org/bcbs/publ/d532.htm.
14 International Financial Reporting Standards Foundation, International Sustainability Standards Board delivers proposals that create comprehensive global baseline of sustainability disclosures (March 2022), IFRS - ISSB delivers proposals that create comprehensive global baseline of sustainability disclosures.
15 US Securities and Exchange Commission (SEC), SEC Proposes Rules to Enhance and Standardize Climate-Related Disclosures for Investors (March 2022), https://www.sec.gov/news/press-release/2022-46.
16 New Zealand Ministry for the Environment, Mandatory climate-related disclosures (June 2022), https://environment.govt.nz/what-government-is-doing/areas-of-work/climate-change/mandatory-climate-related-financial-disclosures/.
17 The Hon Chris Bowen, Minister for Climate Change and Energy, Address to the IGCC 2022 Climate Change Investment and Finance Summit (17 June 2022), https://www.minister.industry.gov.au/ministers/bowen/speeches/address-igcc-2022-climate-change-investment-and-finance-summit.
18 ASIC, ASIC’s corporate governance priorities and the year ahead (March 2022), https://asic.gov.au/about-asic/news-centre/speeches/asic-s-corporate-governance-priorities-and-the-year-ahead/.
19 APRA, APRA’s Supervision Priorities (February 2022), APRA releases its policy and supervision priorities for 2022.
Attachment A: Climate risk self-assessment survey questionnaire
The full climate risk self-assessment survey questionnaire is set out below. The ordering of the questions has been aligned with the thematic structure of this information paper.
APRA encourages smaller APRA-regulated institutions that were not in scope for this survey to consider the questionnaire internally.
Introduction
1 Are material climate risks with respect to your institution considered at your institution’s group level or at the entity level? If your institution is not part of a group, please select entity level.
- Entity level
- Group level
- Both entity and group levels
- Neither entity nor group levels
2 What is the name of your institution? Where there are multiple APRA-regulated institutions within the same group, and climate risk with respect to each institution is considered through a common group framework, please list all the APRA-regulated institutions which are part of your group and covered through this survey response.
Governance & strategy
3 Does your institution’s board or board committee oversee climate risk?
- No, the board does not oversee climate risks
- Yes, on an ad hoc basis
- Yes, on an annual basis
- Yes, on a bi-annual or quarterly basis
- Yes, on a monthly or more frequent basis
4 Has the board undertaken training20 in relation to climate risk? Please respond to this question in regards to your institution’s board itself.
- The board has not undertaken training in relation to climate risk, and does not plan to in the next 12 months
- The board has not undertaken training in relation to climate risk, but intends to in the next 12 months
- The board, or a subset of the board, undertook training in relation to climate risk more than 12 months ago
- The board, or a subset of the board, undertook training in relation to climate risk in the last 12 months
5 Has your institution provided training in relation to climate risk to its staff? Please respond to this question in regards to your institution’s staff (other than the members of the board).
- Training in relation to climate risk has not been provided, and there is no plan to do so in the next 12 months
- Training in relation to climate risk has not been provided, but there are plans to do so in the next 12 months
- Training in relation to climate risk has been provided to a target group of staff (e.g. independent risk function, executive level senior management, sector aligned teams etc.)
- Training in relation to climate risk has been provided to a target group of staff and optional training has been made available to all staff on a voluntary basis
- Training in relation to climate risk has been provided to all staff
If option 3 or 4 is selected in question 5
6 Please describe the target group of staff who has been provided training (e.g. independent risk function, executive level senior management, sector aligned teams) and when the training was provided.
If option 5 is selected in question 5
7 When was the training provided?
- Over 24 months ago
- Between 18 and 24 months ago
- Between 12 and 18 months ago
- Between 6 and 12 months ago
- In the last 6 months
8 Have there been any climate risk considerations in the composition of the board?
- No, climate risk has not been considered in the composition of the board, and there are no plans to do so in the next 12 months
- No, climate risk has not been considered in the composition of the board, but there are plans to do so in the next 12 months
- Yes, climate risk has been considered in the composition of the board: however, the current composition of the board does not include members with expertise or experience in ESG or climate risks specifically
- Yes, climate risk has been considered in the composition of the board, with one or more members of the board having expertise or experience in ESG risks (or similar) but not specifically climate risk
- Yes, climate risk has been considered in the composition of the board, with one or more members of the board having expertise or experience in climate risks specifically (whether or not they have broader ESG or similar expertise)
9 To what extent does the board delegate the management of climate risks to senior management positions and/or management committees?
- Management of climate risks is not formally delegated to senior management, and there is no plan to do so in the next 12 months
- Management of climate risks is not formally delegated to senior management, but there are plans to do so in the next 12 months
- Management of climate risks is formally delegated to a management-level committee
- Management of climate risks is formally delegated to a member of senior management at an executive level (e.g., Chief Risk Officer)
- Management of climate risks is formally delegated to a management-level committee and a member of senior management at an executive level (e.g., Chief Risk Officer)
10 Does your institution clearly define the roles and responsibilities of business lines, independent risk, and assurance functions (i.e., first, second and third lines of defence) in relation to managing climate risks? Please select all that apply.
- No, my institution has not defined the roles and responsibilities related to the management of climate risks across any functions
- Yes, my institution has defined roles and responsibilities for business management (Line 1)
- Yes, my institution has defined roles and responsibilities for the independent risk management function (Line 2)
- Yes, my institution has defined roles and responsibilities for the independent assurance or audit function (Line 3)
11 To what extent does your institution incorporate climate risks into its strategic planning process? Please select all that apply.
- My institution does not formally incorporate climate risks into the strategic planning process
- My institution recognises the potential need to plan for substantive changes in response to current and future climate risks, but has yet to formally incorporate this as part of the strategic planning process
- My institution considers the short term (1-5 years) impact of climate risks as part of the strategic planning process
- My institution considers the medium term (5-10 years) impact of climate risks as part of the strategic planning process
- My institution considers the long term (10 years and beyond) impact of climate risks as part of the strategic planning process
If options 3, 4 or 5 is selected in question 11
12 What substantive changes to business strategy has your institution implemented or planned in response to the impact of current and potential future climate risks? And, what are the key climate risk drivers that would be considered relevant to your institution’s strategy?
Risk Management
13 Does your institution have formal processes in place to identify material climate risks and assess their potential impact on the institution?
- No, my institution does not have a formal process to identify material climate risks, and is not planning to in the next 12 months
- No, my institution does not have a formal process to identify material climate risks, but is planning to within the next 12 months
- Yes, my institution has formal processes in place to identify material climate risks: however, it is yet to have a formalised approach for assessing the potential impact of the risks
- Yes, my institution has formal processes in place to identify material climate risks and assess their potential impact, on an ad hoc basis (e.g., at a time when there are material changes to the size or business mix of the institution)
- Yes, my institution has formal processes in place to identify material climate risks and assess their potential impact, on a regular basis (e.g., semi-annually, or annually)
14 How are climate risks integrated into your institution’s overall risk management framework?
- Climate risks are not considered in the overall risk management framework
- Climate risks are considered on an ad hoc basis without any formal structure
- Climate risks are included in the risk taxonomy/register as an ESG risk (or similar)
- Climate risks are included in the risk taxonomy/register as a unique risk separate from ESG risk (or similar)
- Climate risks are included in the risk taxonomy/register as a unique risk, and is considered as a risk driver of other risks (e.g., credit risk, market risk, reputational risk)
If options 2, 3, 4 or 5 is selected in Question 14
15 Which of the following elements of your institution’s risk management framework specifically considers climate risks? Please select all that apply.
|
| Fully embedded like other risk types | Mostly embedded | Somewhat embedded | Not embedded at all but plan to in the next 12 months | Not embedded at all | Not pplicable for my institution |
a.Risk appetite | ○ | ○ | ○ | ○ | ○ | ○ | |
b.Risk management strategy | ○ | ○ | ○ | ○ | ○ | ○ | |
c.Business plan | ○ | ○ | ○ | ○ | ○ | ○ | |
d.Policies and procedures | ○ | ○ | ○ | ○ | ○ | ○ | |
e.Management information & reporting | ○ | ○ | ○ | ○ | ○ | ○ | |
f.Governance structure and composition | ○ | ○ | ○ | ○ | ○ | ○ | |
g.Training and capacity building | ○ | ○ | ○ | ○ | ○ | ○ | |
h.Capital adequacy | ○ | ○ | ○ | ○ | ○ | ○ | |
If options 2, 3, 4 or 5 is selected in Question 14
16 If your institution has other risk management framework elements which incorporates climate risks, please elaborate.
17 Has your institution undertaken climate-related scenario analysis?
- No, and my institution is not planning to undertake this analysis within the next 12 months
- No, however my institution is planning to undertake climate-related scenario analysis within the next 12 months
- Yes, my institution has undertaken one climate-related scenario analysis
- Yes, my institution has undertaken two climate-related scenario analyses
- Yes, my institution has undertaken three or more climate-related scenario analyses
If option 3, 4 or 5 is selected in question 17
18 What was the source of the climate scenarios that your institution relied on for its scenario analysis?
- Network for Greening the Financial System (NGFS)
- International Energy Agency (IEA)
- Intergovernmental Panel on Climate Change (IPCC)
- Science Based Targets Initiative (SBTi) aligned scenario
- Other (please specify)
If option 3, 4 or 5 is selected in question 17
19 Which climate scenarios did your institution use (e.g., Current Policies and Delayed Transition)?
20 In providing products and services, what climate risk factors does your institution consider when evaluating the potential climate risks faced by your institution’s customers, counterparties, investments and/or assets? Please select all that apply.
- Vulnerability to extreme weather events
- Level of greenhouse gas emissions
- Potential exposure to changes in climate-related policy
- Potential exposure to climate-driven technology changes
- Vulnerability of the counterparty’s business activities or supply chain to climate-related disruption
- Linkages to unsustainable practices
- My institution does not consider any climate risk factors
- Other (please specify)
21 Has your institution sought assistance from any of the following external experts or bodies on climate risk? Please select all that apply.
- Academic experts / institutions
- Specialist consultants
- Scientific agencies
- We have not sought assistance from external experts
- Other (please specify)
22 Assuming no mitigating actions are taken, to what extent is your institution’s business model vulnerable to physical climate risks21 arising from climate change under a high-emissions scenario22?
- Unsure
- Not at all vulnerable - My institution will not be impacted by a high-emissions scenario
- Somewhat vulnerable - The risk is considered to be within an acceptable range of my institution’s current risk appetite and can be managed through existing risk management practices
- Moderately vulnerable - The risk is considered to be within an acceptable range of my institution’s current risk appetite, but existing risk management practices will be, or have been, adapted in response to the risk
- Highly vulnerable - The risk is considered to be close to the maximum level of acceptable risk in my institution’s risk appetite and existing risk management practices will be, or have been, adapted in response
- Extremely vulnerable - The risk is considered to be unacceptable in my institution’s current risk appetite. Risk management practices and business strategy will be, or have been, significantly adapted
23 Please explain your response.
24 Assuming no mitigating actions are taken, to what extent is your institution’s business model vulnerable to transition climate risks23 arising from climate change under a disorderly scenario24?
- Unsure
- Not at all vulnerable - My institution will not be impacted by a disorderly transition scenario
- Somewhat vulnerable - The risk is considered to be within an acceptable range of my institution’s current risk appetite and can be managed through existing risk management practices
- Moderately vulnerable - The risk is considered to be within an acceptable range of my institution’s current risk appetite, but existing risk management practices will be, or have been, adapted in response to the risk
- Highly vulnerable - The risk is considered to be close to the maximum level of acceptable risk in my institution’s risk appetite and existing risk management practices will be, or have been, adapted in response
- Extremely vulnerable - The risk is considered to be unacceptable in my institution’s current risk appetite. Risk management practices and business strategy will be, or have been, significantly adapted
25 Please explain your response.
26 Has your institution considered liability risk25 in relation to climate change?
- No, my institution has not considered liability risk in relation to climate change, and does not plan to in the next 12 months
- No, my institution has not considered liability risk in relation to climate change, but plans to in the next 12 months
- Yes, my institution has considered liability risk originating from clients, counterparties, members, or other stakeholders and how it may impact my institution
27 To what extent could climate-related events impact business continuity for your institution’s own operations?
- My institution has not considered how climate-related events could impact business continuity
- Climate-related events are expected to have no impact on my institution’s business continuity
- Climate-related events are expected to have little impact on my institution’s business continuity, and no substantive changes have been made to business continuity plans
- Climate-related events are expected to have a moderate impact on my institution’s business continuity, and business continuity plans have, or will be, adapted somewhat
- Climate-related events are expected to have a material impact on my institution’s business continuity, and business continuity plans have, or will be, adapted significantly
28 [INSURANCE] How does your institution expect climate-related risks to affect its underwriting business?
- Market demand
- Claims burden
- Market size
- Pricing
- Policy exclusions
- Financial performance
- My institution does not expect climate-related risks will have this affect
- Other factors (please specify)
If option 7 is selected in question 28
29 [INSURANCE] Why does your institution not expect climate-related risks will have this affect?
Metrics & Targets
30 Does your institution have metrics to measure and monitor climate risks?
- No, my institution does not have metrics to measure and monitor climate risks, and does not plan to do so in the next 12 months
- No, my institution does not have metrics to measure and monitor climate risks, but is planning to do so the next 12 months
- My institution does not have quantitative metrics to measure and monitor climate risks, but incorporates qualitative approaches (e.g., narrative driven analysis)
- Yes, my institution has quantitative metrics to measure and monitor climate risks
- Yes, my institution has both qualitative and quantitative metrics to measure and monitor climate risks
If options 3, 4, or 5 is selected in question 30
31 What qualitative or quantitative metrics does your institution have in place, and are they publicly disclosed?
32 What data sources does your institution use to measure and monitor climate risks? Please select all that apply.
- Counterparty emissions data
- Sector-level emissions data
- Sector-level heatmaps/ratings
- Economic modelling
- International policy changes
- Domestic policy changes
- Geographic climate and weather data
- ESG ratings
- My institution does not source specific data for climate risk
- Other (please specify)
33 [ADI] Does your institution assess emissions arising from its wholesale lending exposures26?
- My institution does not assess emissions arising from its lending exposures
- My institution typically assesses the scope 1 emissions arising from its lending exposures
- My institution typically assesses the scope 2 emissions arising from its lending exposures
- My institution typically assesses the material scope 3 emissions arising from its lending exposures
- My institution typically assesses both the scope 1 and 2 emissions arising from its lending exposures
- My institution typically assesses the scope 1, 2 and material 3 emissions arising from its lending exposures
34 [INSURANCE] Does your institution assess emissions arising from its investment assets27?
- My institution does not assess emissions arising from its investment assets
- My institution typically assesses the scope 1 emissions arising from its investment assets
- My institution typically assesses the scope 2 emissions arising from its investment assets
- My institution typically assesses the material scope 3 emissions arising from its investment assets
- My institution typically assesses both the scope 1 and 2 emissions arising from its investment assets
- My institution typically assesses the scope 1, 2 and material 3 emissions arising from its investment assets
35 [SUPERANNUATION] Does your institution assess emissions arising from its investments28?
1. My institution does not assess emissions arising from its investments
2. My institution typically assesses the scope 1 emissions arising from its investments
3. My institution typically assesses the scope 2 emissions arising from its investments
4. My institution typically assesses the material scope 3 emissions arising from its investments
5. My institution typically assesses both the scope 1 and 2 emissions arising from its investments
6. My institution typically assesses the scope 1, 2 and material 3 emissions arising from its investments
If options 2, 3, 4, 5 or 6 are selected in question 33
36 [ADI] Estimate the proportion of your institution’s wholesale lending exposure that it has assessed its relevant scope 3 emissions at either a counterparty, sector, or country level29.
|
| 0% of wholesale lending exposure | Lees than 1% of wholesale lending exposure | 1% to <5% of wholesale lending exposure | 5% to <10% of wholesale lending exposure | 10% to <25% of wholesale lending exposure | 25% to <50% of wholesale lending exposure | 50% to <75% of wholesale lending exposure | 75% to 100% of wholesale lending exposure | NA for my institution |
a.Counterparty level | ○ | ○ | ○ | ○ | ○ | ○ | ○ | ○ | ○ | |
b.Sector level | ○ | ○ | ○ | ○ | ○ | ○ | ○ | ○ | ○ | |
c.Country level
| ○ | ○ | ○ | ○ | ○ | ○ | ○ | ○ | ○ | |
If options 2, 3, 4, 5 or 6 are selected in question 34
37 [INSURANCE] Estimate the proportion of your institution’s investment assets for which it has assessed its relevant scope 3 emissions at either an investment-specific, sector or country level.30
|
| of investment assets | Less than 1% of investment assets | 1% to <5% of investment assets | 5% to <10% of investment assets | 10% to <25% of investment assets | 25% to <50% of investment assets | 50% to <75% of investment assets | 75% to 100% of investment assets |
a.Investment-specific
| ○ | ○ | ○ | ○ | ○ | ○ | ○ | ○ | |
b.Sector level
| ○ | ○ | ○ | ○ | ○ | ○ | ○ | ○ | |
c.Country level
| ○ | ○ | ○ | ○ | ○ | ○ | ○ | ○ | |
If options 2, 3, 4, 5 or 6 are selected in question 35
38 [SUPERANNUATION] Estimate the proportion of your institution’s investment portfolio for which it has assessed its relevant scope 3 emissions at either an investment-specific, sector or country level.31
|
| 0% of investment portfolio | Less than 1% of investment portfolio | 1% to <5% of investment portfolio | 5% to <10% of investment portfolio | 10% to <25% of investment portfolio | 25% to <50% of investment portfolio | 50% to <75% of investment portfolio | 75% to 100% of investment portfolio |
a.Investment level
| ○ | ○ | ○ | ○ | ○ | ○ | ○ | ○ | |
b.Sector level
| ○ | ○ | ○ | ○ | ○ | ○ | ○ | ○ | |
c.Country level
| ○ | ○ | ○ | ○ | ○ | ○ | ○ | ○ | |
39 [ADI] Estimate the proportion of your institution’s wholesale lending exposure for which it has assessed the financial impact of physical and transition risks at either a counterparty, sector, or country level32.
| 0% of wholesale lending exposure | > 1% of wholesale lending exposure | 1% to <5% of wholesale lending exposure | 5% to <10% of wholesale lending exposure | 10% to <25% of wholesale lending exposure | 25% to <50% of wholesale lending exposure | 50% to <75% of wholesale lending exposure | 75% to 100% of wholesale lending exposure | Not applicable for my institution |
a.level physical risk | ○ | ○ | ○ | ○ | ○ | ○ | ○ | ○ | ○ |
b.level transition risk | ○ | ○ | ○ | ○ | ○ | ○ | ○ | ○ | ○ |
c.level physical risk | ○ | ○ | ○ | ○ | ○ | ○ | ○ | ○ | ○ |
d.level transition risk | ○ | ○ | ○ | ○ | ○ | ○ | ○ | ○ | ○ |
e.level physical risk | ○ | ○ | ○ | ○ | ○ | ○ | ○ | ○ | ○ |
f.Country level transition risk | ○ | ○ | ○ | ○ | ○ | ○ | ○ | ○ | ○ |
40 [INSURANCE] Estimate the proportion of your institution’s investment assets for which it has assessed the financial impact of physical and transition risks at either an investment-specific, sector or country level.33
|
| 0% of investment assets | than 1% of investment assets | to <5% of investment assets | to <10% of investment assets | to <25% of investment assets | to <50% of investment assets | to <75% of investment assets | % to 100% of investment assets |
a.Investment level physical risk | ○ | ○ | ○ | ○ | ○ | ○ | ○ | ○ | |
b.Investment level transition risk | ○ | ○ | ○ | ○ | ○ | ○ | ○ | ○ | |
c.Sector level physical risk | ○ | ○ | ○ | ○ | ○ | ○ | ○ | ○ | |
d.Sector level transition risk | ○ | ○ | ○ | ○ | ○ | ○ | ○ | ○ | |
e.Country level physical risk | ○ | ○ | ○ | ○ | ○ | ○ | ○ | ○ | |
f.Country level transition risk | ○ | ○ | ○ | ○ | ○ | ○ | ○ | ○ | |
41 [SUPERANNUATION] Estimate the proportion of your institution’s investment portfolio for which it has assessed the financial impact of physical and transition risks at either an investment-specific, sector or country level.34
|
| 0% of investment portfolio | than 1% of investment portfolio | to <5% of investment portfolio | to <10% of investment portfolio | to <25% of investment portfolio | to <50% of investment portfolio | to <75% of investment portfolio | to 100% of investment portfolio |
a.Investment level physical risk | ○ | ○ | ○ | ○ | ○ | ○ | ○ | ○ | |
b.Investment level transition risk | ○ | ○ | ○ | ○ | ○ | ○ | ○ | ○ | |
c.Sector level physical risk | ○ | ○ | ○ | ○ | ○ | ○ | ○ | ○ | |
d.Sector level transition risk | ○ | ○ | ○ | ○ | ○ | ○ | ○ | ○ | |
e.Country level physical risk | ○ | ○ | ○ | ○ | ○ | ○ | ○ | ○ | |
f.Country level transition risk | ○ | ○ | ○ | ○ | ○ | ○ | ○ | ○ | |
42 [ADI] Estimate the proportion of your institution’s mortgage lending exposure for which it has assessed the financial impact of physical and transition risks at either an address, post-code, or state/country level.35
|
| 0% of mortgage lending exposure | 1% of mortgage lending exposure | to <5% of mortgage lending exposure | to <10% of mortgage lending exposure | to <25% of mortgage lending exposure | to <50% of mortgage lending exposure | to <75% of mortgage lending exposure | to 100% of mortgage lending exposure | applicable for my institution |
a,Address level physical risk | ○ | ○ | ○ | ○ | ○ | ○ | ○ | ○ | ○ | |
b.Address level transition risk | ○ | ○ | ○ | ○ | ○ | ○ | ○ | ○ | ○ | |
c.Post code level physical risk | ○ | ○ | ○ | ○ | ○ | ○ | ○ | ○ | ○ | |
d.Post code level transition risk | ○ | ○ | ○ | ○ | ○ | ○ | ○ | ○ | ○ | |
e.State or country level physical risk | ○ | ○ | ○ | ○ | ○ | ○ | ○ | ○ | ○ | |
f.State or country level transition risk | ○ | ○ | ○ | ○ | ○ | ○ | ○ | ○ | ○ | |
43 Has your institution set any climate-related targets for its activities?
- No, my institution does not have climate-related targets in place, and is not planning to put targets in place within the next 12 months
- No, my institution does not have climate-related targets in place. However, the institution is planning to set targets in the next 12 months
- Yes, my institution has climate-related targets in place (including one of the following: absolute or intensity-based targets; time frames; base year from which progress is measured; scope of emissions covered; and key performance indicators used to assess progress against targets)
- Yes, my institution has climate-related targets in place (including two of the following: absolute or intensity-based targets; time frames; base year from which progress is measured; scope of emissions covered; and key performance indicators used to assess progress against targets)
- Yes, my institution has climate-related targets in place (including three or more of the following: absolute or intensity-based targets; time frames; base year from which progress is measured; scope of emissions covered; key performance indicators used to assess progress against targets)
If options 3, 4 or 5 is selected in question 43
44 What targets has your institution set in place (including time horizon) and how are these reported?
If options 3, 4 or 5 is selected in question 43
45 Please explain the circumstances which may trigger a review of your institution’s climate-related targets?
Disclosures
46 Does your institution publicly disclose its approach to measuring and managing climate risks, including metrics and targets?
- No, and my institution has no plans to make any public disclosures in the next 12 months
- No, but my institution plans to make public disclosures in the next 12 months
- Yes, my institution publicly discloses its approach to measuring and managing climate risks, but does not disclose metrics and targets
- Yes, my institution publicly discloses its approach to measuring and managing climate risks, and discloses key metrics and targets that it has set for itself
- Yes, my institution publicly discloses its approach to measuring and managing climate risks, and discloses key metrics and targets that have been set using an independent process or framework
If option 3, 4 or 5 is selected in question 46
47 Was your institution’s most recent disclosure aligned to the Financial Stability Board Task Force on Climate-related Financial Disclosures (TCFD) framework?
- No, and my institution has no plan to align with the TCFD framework in the next 12 months
- No, but my institution plans to align with the TCFD framework in the next 12 months
- Yes, my institution’s disclosures are aligned to the TCFD framework
Footnotes
20Training: examples may include in-person or online training sessions, seminars, workshops or roundtables facilitated by internal or external parties.
21Physical climate risks: including both longer-term changes in climate (chronic risk) as well as changes to the frequency and magnitude of extreme weather events (acute risk), can cause direct damage to assets or property, changes to income and costs, and changes to the cost and availability of insurance.
22High-emissions scenario: assumes that only currently implemented policies are preserved leading to a 3°C or more of warming by 2100.
23Transition climate risks: include risks related to changes in domestic and international policy and regulatory settings, technological innovation, social adaptation and market changes, which can result in changes to costs, income and profits, investment preferences and asset viability.
24Disorderly transition scenario: assumes additional climate policies are not implemented until 2030, and global warming is limited to below 2°C.
25Liability risks: stem from the potential for litigation where institutions and boards do not adequately consider or respond to the impacts of climate change.
26 Assess: Includes estimates of the total emissions or the emissions intensity of wholesale lending exposures.
Emissions: The scope 1, scope 2 and material scope 3 emissions from businesses to which your institution has a financial exposure through its wholesale lending (“relevant scope 3 emissions” as per page 13 of the APRA’s Prudential Practice Guide CPG 229 Climate Change Financial Risks).
Wholesale lending: Includes commercial and/or institutional lending.
27Assess: Includes estimates of the emissions or the emissions intensity of investment assets.
Emissions: The scope 1, scope 2 and material scope 3 emissions from businesses to which your institution has a financial exposure through its investment assets (“relevant scope 3 emissions” as per page 13 of the APRA’s Prudential Practice Guide CPG 229 Climate Change Financial Risks).
28Assess: Includes estimates of the emissions or the emissions intensity of investments.
Emissions: The scope 1, scope 2 and material scope 3 emissions from businesses to which your institution has a financial exposure through its investments (“relevant scope 3 emissions” as per page 13 of the APRA’s Prudential Practice Guide CPG 229 Climate Change Financial Risks).
29Wholesale lending: Includes commercial and/or institutional lending.
Relevant scope 3 emissions: The scope 1, scope 2 and material scope 3 emissions from businesses to which your institution has a financial exposure through its wholesale lending (“relevant scope 3 emissions” as per page 13 of the APRA’s Prudential Practice Guide CPG 229 Climate Change Financial Risks).
Counterparty: The emissions assessment is based on current or historic counterparty-specific emissions data.
Sector: The emissions assessment is based on current or historic industry-average emissions intensity data for the major sector and country of operation of the counterparty, and applied either to individual counterparties or to aggregations of counterparties (e.g. grouped at a sector level). Where a counterparty operates across sectors and/or countries, weighting of emissions by sector & country of production and emissions intensity may be carried out.
Country: The emissions assessment is based on current or historic country average emissions intensity of production being applied to the counterparty.
30Relevant scope 3 emissions: The scope 1, scope 2 and material scope 3 emissions from businesses to which your institution has a financial exposure through its investment assets (“relevant scope 3 emissions” as per page 13 of the APRA’s Prudential Practice Guide CPG 229 Climate Change Financial Risks).
Investment-specific: The emissions assessment is based on current or historic investment-specific emissions data.
Sector: The emissions assessment is based on current or historic industry-average emissions intensity data for the major sector and country of operation of the investment, and applied either to individual investments or to aggregations of investments (e.g. grouped at a sector level). Where an investment operates across sectors and/or countries, weighting of emissions by sector & country production and emissions intensity may be carried out.
Country: The emissions assessment is based on current or historic country average emissions intensity of activity being applied to your institution’s investments.
31Relevant scope 3 emissions: The scope 1, scope 2 and material scope 3 emissions from businesses to which your institution has a financial exposure through its investments (“relevant scope 3 emissions” as per page 13 of the APRA’s Prudential Practice Guide CPG 229 Climate Change Financial Risks).
Investment-specific: The emissions assessment is based on current or historic investment-specific emissions data.
Sector: The emissions assessment is based on current or historic industry-average emissions intensity data for the major sector and country of operation of the investment, and applied either to individual investments or to aggregations of investments (e.g. grouped at a sector level). Where an investment operates across sectors and/or countries, weighting of emissions by sector & country production and emissions intensity may be carried out.
Country: The emissions assessment is based on current or historic country average emissions intensity of activity being applied to your institution’s investments.
32Physical: Assessments include forward-looking physical risk factors such as heat stress, wildfires, floods, cyclones and sea level rises.
Transition: Assessments include forward-looking transition risks such as changes in climate-related policies, technology innovation and customer sentiment, and/or quantifying the impact of adaptation measures.
Counterparty: The assessment is based on counterparty-specific physical and/or transition risk assessment(s).
Sector: The assessment is based on sector-average physical and/or transition risk assessment(s) for the major sector and country of operation of the counterparty, and applied either to individual counterparties or to aggregations of counterparties (e.g. grouped at sector level). Where an entity operates across sectors and/or countries, weighting of the physical and/or transition risks by sector & country may be carried out.
Country: The assessment is based on country average physical and/or transition risks being applied to your institution’s counterparty.
33Physical: Assessments include forward-looking physical risk factors such as heat stress, wildfires, floods, cyclones and sea level rises.
Transition: Assessments include forward-looking transition risks such as changes in climate-related policies, technology innovation and customer sentiment, and/or quantifying the impact of adaptation measures.
Investment-specific: The assessment is based on investment-specific physical and/or transition risk assessment(s).
Sector: The assessment is based on sector-average physical and/or transition risk assessment(s) for the major sector and country of operation of the investment, and applied either to individual investments or to aggregations of investments (e.g. grouped at sector level). Where an investment operates across sectors and/or countries, weighting of the physical and/or transition risks by sector & country may be carried out.
Country: The assessment is based on country average physical and/or transition risks being applied to your institution’s investments.
34Physical: Assessments include forward-looking physical risk factors such as heat stress, wildfires, floods, cyclones and sea level rises.
Transition: Assessments include forward-looking transition risks such as changes in climate-related policies, technology innovation and customer sentiment, and/or quantifying the impact of adaptation measures.
Investment-specific: The assessment is based on investment-specific physical and/or transition risk assessment(s).
Sector: The assessment is based on sector-average physical and/or transition risk assessment(s) for the major sector and country of operation of the investment, and applied either to individual investments or to aggregations of investments (e.g. grouped at sector level). Where an investment operates across sectors and/or countries, weighting of the physical and/or transition risks by sector & country may be carried out.
Country: The assessment is based on country average physical and/or transition risks being applied to your institution’s investments.
35Physical: Assessments include forward-looking physical risk factors such as heat stress, wildfires, floods, cyclones and sea level rises.
Transition: Assessments include forward-looking transition risks such as changes in climate-related policies, technology innovation and customer sentiment, and/or quantifying the impact of adaptation measures.
Address: The assessment is based on the street address of individual properties to which your institution has a mortgage lending exposure.
Post code: The assessment is based on post code level or similar (e.g. Australian Statistical Geography Standard (ASGS) Statistical Areas Level 1-4)